Analysis of the current state
Developed by Philip Rønne Nielsen
This article considers the analysis of the current state. A throughout analysis of the current state in the beginning of a project can save the project managers and other involved people a lot time in the long run of the project. Using the simple tools reviewed in this article as a part of the situation analysis it is possible to gain a very good overview of complex structures, beneficial for project and program management and people in project groups. The tool can be used to make an overview of communications, stakeholders and flows of different resources and is very simple to use. The good project result is always based on the well-defined task and well-known overview of the situation.
Even the method is very useful it is unfortunately not mentioned much in the literature.
Contents |
Introduction
The analysis of the current state is a part of the situation analysis, which is the first step in the Problem Solving Cycle (PSC). The problem solving cycle is constructed with overlapping steps that continue until the project demands and conditions are met or the project resources are depleted. It is based on information flow and are starting with a focus on the problem recognition and problem definition. [1]
The method comprises a systematic analysis of the situation and is used to formulate goals and create the necessary overview to search for solutions within the given project. The situation analysis can furthermore be divided into more steps:
- Task analysis
- Analysis of the current state
- Analysis of the future state
- Identification of the problems and actions that need to be taken
The primary focus in this article will be on the analysis of the current state, where it will be looking into methods that can give an overview of the environment and connections within complex systems. The basic rule is to get an overview and thereafter it is possible to demarcate the system from its environment.
At the start of a project it is very important to know exactly; what is the task or tasks in the given project? To solve a problem it should be clear for both the project group but especially for the project manager what the task is. Therefore, the task should be stated correctly in the start of a project. This task analysis can be made by analyse and question the task with critique questions. Furthermore, important aspects should be identified in the system. The analysis of the current state will benefit from a detailed study.
The primary step in the analysis of the current state is the demarcation of the system. The map of the system can be split up into the following six overlapping areas:
- Intervention System
- Surrounding System
- Environment
- Area of investigation
- Area of effect
- Area of Solution
To create a good understanding about the essential part of the system, different known tools such as interviews, observations and desk studies are normally used. In this article we will also look into some different simple tools that can be used together with the system demarcation to give an better output from the analysis.
Analysis of the current state
The analysis of the current state is based on information found in the task analysis. The analysis are split in two parts. Firstly demarcation of the system and its environment and secondly analysis of the system and relevant parts of the system. In practice these two parts will be more overlapping because it is a part of an iterative process. Furthermore some different variations of the methods can be used in the analysis.
Demarcation of the system
The demarcation of the system is the essential part of the situation analysis. The overview is gained here. The first step is to create a map of the system. This depends on which project it is used for. For instance it can be connections of different stakeholders or it can be connections of processes, maybe in a production environment. To create a useful system demarcation it is important using a correct map in the beginning of the process.
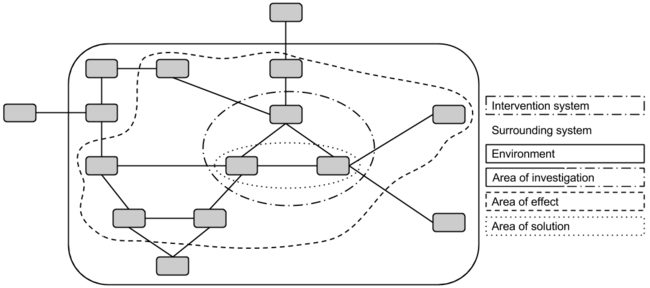
When the system is mapped, it can be marked into the following six overlapping areas to identify the most important parts of the system [2] [3]:
Intervention system is the area where interventions and modifications that are related to the problem can be made.
Surrounding system is all the area that are external to the intervention system.
Environment is that part of the surrounding system that is relevant to the problem itself.
Area of investigation is the sum of the intervention system and the environment.
Area of effect is the area where effects from the solution can be expected. This may include parts of the surrounding system.
Area of solution is the part of the intervention system that is used for the solution.
To help demarcating the system in these six areas it could help to answer the following questions [3]:
- Where are interventions and changes possible? What degree of freedom exists? In which areas are changes conceivable?
- Which functions do the system have to control? Which structures are present?
- What authority does the client have? Does it correspond to the system boundaries?
- Should an extended system demarcation be considered?
- What influencing variables affect the system? Which ones are relevant for the task?
- In which area do changes in the system design change the environmental effects? What quality do they have? Which one are relevant?
- Where can effects from the solution be expected? Can the effected areas effect other parts of the environment?
These questions can help ensuring that the demarcation of the system is made correctly. Figure 1 illustrated an example of a system demarcation.
The illustration clarify how the different areas can look in relation to each other. The system are often much more complex with many more items and connections.
Analyzing the system and relevant areas
When the system demarcation is made, the more systematic analysis of the relevant areas of the system can be made. This second part of the current state analysis is intended to analyse the structure and function of the relevant areas regarding the project. Gathering further information can be done using multiple methods:
- Interviews
- Questionnaires
- Observations (Participating observation, work process analysis, work sampling)
- Desk research
When doing the further analysis it is very important to be critical of the outcome using these methods. The interviewer always carries the risk that the interviewed person deliberately or inadvertently bias their answers. Both for the interviews and questionnaires the questions should be selected carefully and evaluated. It is always a very good idea to know the interviewed or observed persons interests in the project. By knowing the different interests it is much easier to prevent conflicts.
One can use some of the following methods to create a visual overview of the relevant areas in the map from the demarcation of the system.
Variations in the use of systems
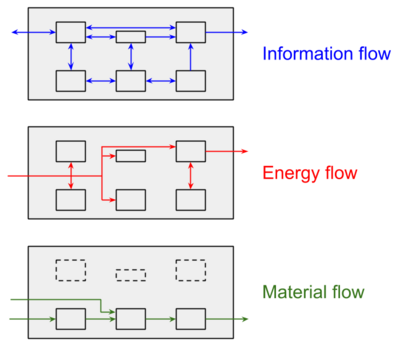
The connections between the elements within the map can be used with different flows of resources, such as information, energy or physical parts moving between elements etc., while the elements can vary between stakeholder, organizations, departments, persons, processes, machines etc. The type of connection and element depends on the type of project within it is used in and where the overview is needed in the current situation. Sometimes more than one point of view is needed in the situation. Therefore, the same system can be illustrated with different flows to get the necessary overview of the situation as shown in figure 2. This is an example where an overview of different flows is needed to analyse the situation.
Colors may be used to clarify the different flows. In the illustrated example a blue color is used to display the information flow in the system, a red color for the energy flow and green for the material flow. This is one simple tool that can help simplifying complex systems.
There are many options using graphical tools. In the most graphical mapping it is possible to include more variables. Some of the more used variables are:
- Colors of lines
- Colors of boxes
- Varying line sizes and types
- Varying arrow sizes and types
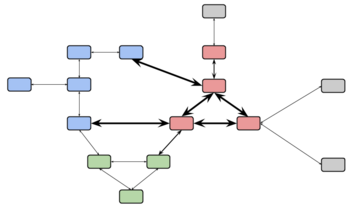
An example of a map with variables are shown in figure 3.
The different colors of the boxes can illustrate different departments and the size of the arrows can for example illustrate the amount of information within the area of the project scope.
Black boxing and system hierarchy
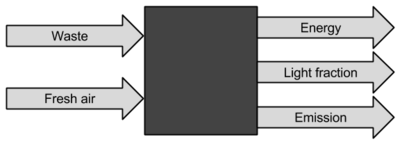
If the system consists of some detailed connections, which are not relevant for the project, because the project is focusing on the surrounding (input/output) it would not make sense to use resources on sketching the detailed part of the system. Instead, a black box could be used to illustrate that there is a mechanism behind and then clearly show the connections or input/output of the black box that are important for the situation analysis to the project. This brings a significant reduction of the complexity at the first look. An example of such a black box is shown in figure 4.
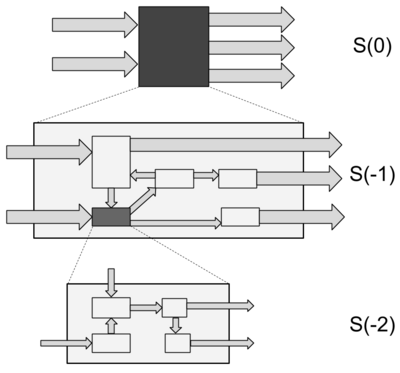
Furthermore, the black box can be used if the system is illustrated on different levels in a hierarchy. This method builds up on black boxes that are shown in the level below. The system is then considered as a black box in the highest system level S(0), that makes the complexity significantly lower. The inside of the black box from S(0) is then illustrated in the next level of the hierarchy S(-1). This can continue in several levels S(-i). This can be used to minimize the complexity of the system. In some projects people could be working on different levels and therefore want the more simple overview on that specific level their area are stated. An example of the system hierarchy with three levels is stated in figure 5 below.
This can give the necessary overview on the different levels of the environment and creates a naturally focus on the relevant area. In some cases it could be relevant to use two black boxes on the same level, if their is more interesting parallel levels.
Stakeholders
In order to manage project stakeholders and identify all potential stakeholder in the analysis of the current state, is often used a stakeholder analysis. In many projects it is necessary to know the stakeholders and their interests in the projects. This can help the responsible to take the right decisions during the project. The first step within project stakeholder management according to the Project management standard from PMI (PMBOK), is to identify stakeholders. The following is stated in the standard:
“Identify Stakeholders—The process of identifying the people, groups, or organizations that could impact or be impacted by a decision, activity, or outcome of the project; and analyzing and documenting relevant information regarding their interests, involvement, inter dependencies, influence, and potential impact on project success.” [4]
An often used tool during stakeholder analysis is a power/interest grid or power/influence grid that group the stakeholders based on their level of authority. By using the system demarcation tool as a “stakeholder map” showing the stakeholders connections, it can help defining their authority within the project. The amount of authority is often related to their connections and coordinates between each other.
Discussion and further work
The analysis of the current state is definitely a usable method, by systematically using the mapping, demarcation of the system and the more systematically approach including interviews, questionnaires, observations and desk research. The situation analysis may not be sensible to use in all projects, but is a bunch of methods that can be used in different variations depending on the systems. The system demarcation can for example help creating an overview of complex systems and environments, but if the system is less complex and there is a clear overview from the start it would maybe make more sense to start doing the surveys and observations.
It is important to remember this tool is not solving the problem but only helps in the long run by reducing uncertainty and creating overview of the complexity. It can also be used to get overview in program and portfolio management issues where the amount of data and connections could be even bigger and much more complex.
A further work in the situation analysis would as mentioned in the introduction be to analyse the future state. Figure out what need to be changed to gain the goal and what are the opportunities to get there. This work can for example be achieved using SWOT Analysis, which look into the opportunities and threats followed by the strengths and weaknesses.
Summary and conclusion
Using time on simple tools during the situation analysis can help getting an overview of complex project environments. The tools put the situation into system and help stating the connections in the important areas. The methods themselves are relatively simple but require time used on the task analysis. Within the analysis of the current state the mapping of the situation is an essential part. Different tools such as black boxing, system hierarchy and variable graphics can be used to make the graphical overview better if they are modified to suit the current project.
References
- ↑ M.J. Kolkman & M. Kok & A. van der Veen (2005), Mental model mapping as a new tool to analyse the use of information in decision-making in integrated water management, Physics and Chemistry of the Earth 30 (p. 317-332)
- ↑ C. Thuesen & J. Oehmen, DTU Course 42433 Advanced Engineering Project, Program and Portfolio Management Lecture 3 slides
- ↑ 3.0 3.1 R. Züst & P. Troxler, No More Muddling Through Mastering Complex Projects in Engineering and Management, Springer (2006)
- ↑ PMI, Project Management Body of Knowledge, Project management standard
