Risk Quantification
| Line 11: | Line 11: | ||
===Inputs and Outputs of Risk Quantification=== | ===Inputs and Outputs of Risk Quantification=== | ||
In risk quantification process of a project, there are inputs that should be considered with delegate care and as a result of risk quantification process outputs are generated. According to PMBOK, following inputs are considered and outputs are produced in risk quantification process of any project: | In risk quantification process of a project, there are inputs that should be considered with delegate care and as a result of risk quantification process outputs are generated. According to PMBOK, following inputs are considered and outputs are produced in risk quantification process of any project: | ||
| − | {| class="wikitable" | + | {| class="wikitable" style="margin-left: auto; margin-right: auto; border: none; width: 70%;" |
| + | |+ style="text-align: left;" | Table 1: Inputs and Outputs to Risk Quantification in Project Management | ||
|- | |- | ||
! Inputs | ! Inputs | ||
| Line 32: | Line 33: | ||
|} | |} | ||
| − | |||
===Purpose and Concept === | ===Purpose and Concept === | ||
| Line 42: | Line 42: | ||
<div style="text-align: center;"><math>R = P\times I</math></div><br /> | <div style="text-align: center;"><math>R = P\times I</math></div><br /> | ||
| − | |||
| − | |||
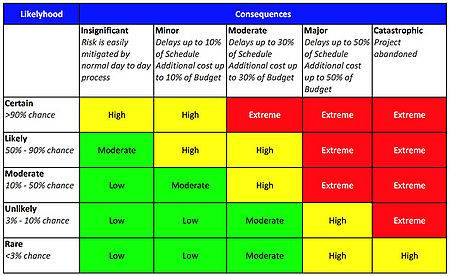
<div style="text-align: justify;">Once risks are quantified then these are evaluated against a defined risk criteria or risk matrix. Red zone in a risk matrix may represents unacceptable risks, yellow zone as acceptable risk, and green zone as neglectable risks. For example, if an event has a likelihood of class “Likely” and it has a severity class “Catastrophic” then it may lie in red zone of risk matrix. This may mean that this risk is not acceptable and appropriate or immediate actions should be applied to lower this risk into acceptable zone. Figure 1 shows an example of risk matrix of a project. First column represents criteria for likelihood, where, first row represents criteria for consequence. Further, nature of any possible risk is defined based on both likelihood and consequence from low, moderate, high, to extreme. </div><br /> | <div style="text-align: justify;">Once risks are quantified then these are evaluated against a defined risk criteria or risk matrix. Red zone in a risk matrix may represents unacceptable risks, yellow zone as acceptable risk, and green zone as neglectable risks. For example, if an event has a likelihood of class “Likely” and it has a severity class “Catastrophic” then it may lie in red zone of risk matrix. This may mean that this risk is not acceptable and appropriate or immediate actions should be applied to lower this risk into acceptable zone. Figure 1 shows an example of risk matrix of a project. First column represents criteria for likelihood, where, first row represents criteria for consequence. Further, nature of any possible risk is defined based on both likelihood and consequence from low, moderate, high, to extreme. </div><br /> | ||
| + | [[File:Risk Matrix of a project.jpg|thumb| |upright=2.5||center||Figure 1: Example of risk matrix of a project (source: http://www.cbisco.com.au/wp-content/uploads/2014/06/aa.jpg)]] | ||
===Importance=== | ===Importance=== | ||
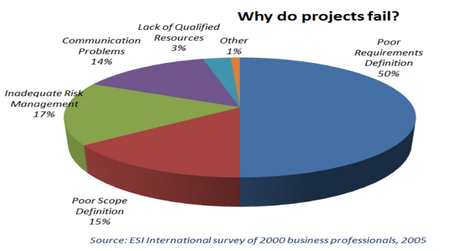
| + | [[File:Why projects fail.png|thumb| |upright=2.5||right||Figure 2: Causes of project failure (source: https://media.licdn.com/mpr/mpr/shrinknp_800_800/AAEAAQAAAAAAAAg4AAAAJDVlMzhiNDM5LWJlMWUtNGU5Zi05ZTY4LTAzYWRhODM5YjhmYQ.png)]] | ||
<div style="text-align: justify;">The term risk or risk assessment may sound like a modern scientific concept, but the idea of risk is as old as recorded human history. The gambling, the very essence of risk, was a popular pastime that inspired Pascal and Fermat’s revolutionary breakthrough into laws of probability <ref>[''Bernstein P.L., “Against the Gods: The remarkable story of risk”, John Wiley & Sons, New York, (1996).''] </ref>. However, Risk as a scientific field is quite young. Around 30-40 years ago scientific journals, papers, and conferences started to cover this idea and principles on how to assess and manage risk <ref>[''Aven T., “Risk assessment and risk management: Review of recent advances on their foundation”, European journal of operational research, (2016), Vol. 253, No. 1, pp. 1-13.'']</ref>. Figure 2 shows that 17% of projects were failed due to inadequate risk management. </div><br /> | <div style="text-align: justify;">The term risk or risk assessment may sound like a modern scientific concept, but the idea of risk is as old as recorded human history. The gambling, the very essence of risk, was a popular pastime that inspired Pascal and Fermat’s revolutionary breakthrough into laws of probability <ref>[''Bernstein P.L., “Against the Gods: The remarkable story of risk”, John Wiley & Sons, New York, (1996).''] </ref>. However, Risk as a scientific field is quite young. Around 30-40 years ago scientific journals, papers, and conferences started to cover this idea and principles on how to assess and manage risk <ref>[''Aven T., “Risk assessment and risk management: Review of recent advances on their foundation”, European journal of operational research, (2016), Vol. 253, No. 1, pp. 1-13.'']</ref>. Figure 2 shows that 17% of projects were failed due to inadequate risk management. </div><br /> | ||
| + | |||
| + | |||
| + | |||
| + | |||
| + | |||
| + | |||
| + | |||
| + | |||
=Applications= | =Applications= | ||
| Line 71: | Line 79: | ||
===Monte Carlo Analysis or Simulation=== | ===Monte Carlo Analysis or Simulation=== | ||
<div style="text-align: justify;">Monte Carlo is a computerized mathematical simulation technique that is used to quantify risks in project management. This technique is helpful in seeing the probable outcomes of decisions and assesses the impact of risk that is useful in decision making [http://www.palisade.com/risk/monte_carlo_simulation.asp]. Most likely and least likely estimates of risks are provided for each event and then these estimates are summed together to calculate a range of possible outcome. Monte Carlo simulation then generates random values between the range and calculates the number of occurrences the value lies within each possible outcome. This probability is then distributed and the decision is made based on the most probable outcome. | <div style="text-align: justify;">Monte Carlo is a computerized mathematical simulation technique that is used to quantify risks in project management. This technique is helpful in seeing the probable outcomes of decisions and assesses the impact of risk that is useful in decision making [http://www.palisade.com/risk/monte_carlo_simulation.asp]. Most likely and least likely estimates of risks are provided for each event and then these estimates are summed together to calculate a range of possible outcome. Monte Carlo simulation then generates random values between the range and calculates the number of occurrences the value lies within each possible outcome. This probability is then distributed and the decision is made based on the most probable outcome. | ||
| − | For example, if there are three tasks required in an e-learning project. Best case, most likely, and worst case estimates of all the tasks required are given in figure | + | For example, if there are three tasks required in an e-learning project. Best case, most likely, and worst case estimates of all the tasks required are given in figure 5. It can be seen that the project is most likely to complete in between 11 and 23 days. Now for example, if Monte Carlo simulation is run 500 times generating random values between 11 and 23. The total number of times the simulation result was less than or equal to projected duration is calculated as shown in figure 6. Then, the probability of each projected duration is calculated and distributed as shown in figure 7. It can be seen that, from figure 5, the most likely projected completion time is 17 days. But, as per figure 7, Monte Carlo simulation shows that likelihood of project completion in 17 days is almost 33%. Whereas, the likelihood of project completion in 19 days is 88%. Hence, it can be estimated that the project will most likely complete in 19 to 20 days. [http://quantmleap.com/blog/2010/07/project-risk-management-and-the-application-of-monte-carlo-simulation/] |
| − | Monte Carlo simulation is usually used in cost and schedule estimation. It can also be used in large projects or programs. The benefits of using Monte Carlo are easiness of tool, numerical estimation, and greate level of confidence | + | Monte Carlo simulation is usually used in cost and schedule estimation. It can also be used in large projects or programs. The benefits of using Monte Carlo are easiness of tool, numerical estimation, and greate level of confidence [http://quantmleap.com/blog/2010/07/project-risk-management-and-the-application-of-monte-carlo-simulation/]. Whereas drawbacks or challenges are the use of right distribution as wrong distribution may lead to wrong results, input estimates as right estimates are required to produce right results, and use of right mathematical formula in the software.[http://abovethelaw.com/2016/05/finance-and-law-the-pros-and-cons-of-monte-carlo-simulations-in-valuation/] |
</div><br /> | </div><br /> | ||
[[File:Result of probability distribution after Monte Carlo simulation.png |thumb| |upright=2.5||center||Figure 8: Result of probability distribution as a result of Monte Carlo simulation (source: http://quantmleap.com/blog/2010/07/project-risk-management-and-the-application-of-monte-carlo-simulation/)]] | [[File:Result of probability distribution after Monte Carlo simulation.png |thumb| |upright=2.5||center||Figure 8: Result of probability distribution as a result of Monte Carlo simulation (source: http://quantmleap.com/blog/2010/07/project-risk-management-and-the-application-of-monte-carlo-simulation/)]] | ||
Revision as of 17:05, 22 September 2017
Contents |
Introduction
Definition
Inputs and Outputs of Risk Quantification
In risk quantification process of a project, there are inputs that should be considered with delegate care and as a result of risk quantification process outputs are generated. According to PMBOK, following inputs are considered and outputs are produced in risk quantification process of any project:
| Inputs | Outputs |
|---|---|
| Stakeholder Risk Tolerance: Every organization and different individuals may have different tolerance for risk value | Opportunities to Pursue, Threats to Respond to: The list of opportunities that should be pursued and threats that should be taken care of. |
| Sources of Risks: Categories of possible risk events that may negatively affect the outcome of a project. For example, Designs errors, stakeholder actions, or poor estimates etc. | Opportunities to Ignore, Threats to Accept: List of opportunities that can be ignored and threats that can be accepted. |
| Potential Risk Events: Discrete occurrences that can occur during a project that may affect the outcome of the project. Such as natural disaster or departure of key member etc. | |
| Cost Estimates: Assessment of likely cost required to complete the project activities. | |
| Activity Duration Estimate: Quantitative assessment of likely number of work period required to activities of a project |
Purpose and Concept


Importance
Applications
Expert Opinion
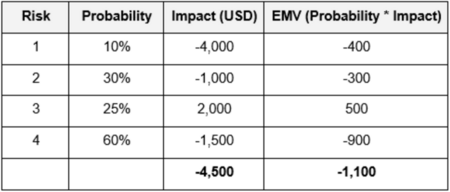
Expected Monetary Value (EMV)
Statistical Sums

Monte Carlo Analysis or Simulation
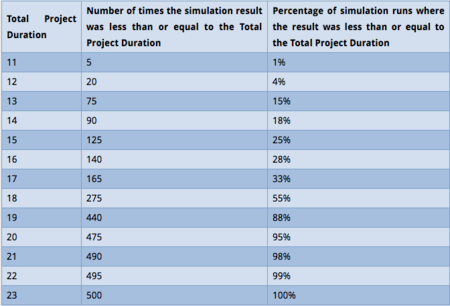
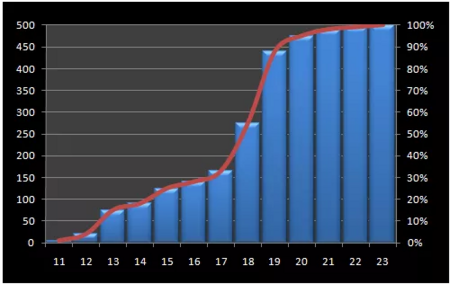
For example, if there are three tasks required in an e-learning project. Best case, most likely, and worst case estimates of all the tasks required are given in figure 5. It can be seen that the project is most likely to complete in between 11 and 23 days. Now for example, if Monte Carlo simulation is run 500 times generating random values between 11 and 23. The total number of times the simulation result was less than or equal to projected duration is calculated as shown in figure 6. Then, the probability of each projected duration is calculated and distributed as shown in figure 7. It can be seen that, from figure 5, the most likely projected completion time is 17 days. But, as per figure 7, Monte Carlo simulation shows that likelihood of project completion in 17 days is almost 33%. Whereas, the likelihood of project completion in 19 days is 88%. Hence, it can be estimated that the project will most likely complete in 19 to 20 days. [10] Monte Carlo simulation is usually used in cost and schedule estimation. It can also be used in large projects or programs. The benefits of using Monte Carlo are easiness of tool, numerical estimation, and greate level of confidence [11]. Whereas drawbacks or challenges are the use of right distribution as wrong distribution may lead to wrong results, input estimates as right estimates are required to produce right results, and use of right mathematical formula in the software.[12]
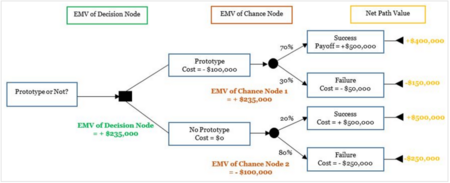
Decision Trees
Limitations and Challenges
Annotated Bibliography
References
- ↑ 1.0 1.1 1.2 1.3 [Duncan W. R., “A Guide to Project Management Body of Knowledge (PMBOK)”, PMI Standards Committee, (2013).]
- ↑ [Bernstein P.L., “Against the Gods: The remarkable story of risk”, John Wiley & Sons, New York, (1996).]
- ↑ [Aven T., “Risk assessment and risk management: Review of recent advances on their foundation”, European journal of operational research, (2016), Vol. 253, No. 1, pp. 1-13.]
- ↑ [Yildiz A. Z. et al, “Using expert opinion for risk assessment: a case study of a construction project utilizing a risk mapping tool “, Procedia - Social and Behavioral Sciences, (2014), Vol. 119, pp. 519-528.]
