Resources loading, leveling and crashing
(→Burgess Method) |
(→Burgess Method) |
||
| Line 49: | Line 49: | ||
# Choose the best schedule obtained. | # Choose the best schedule obtained. | ||
# Make final adjustments to the chosen schedule in Step 6 by taking into considerations factors and requirements that were not considered in the initial scheduling procedure. | # Make final adjustments to the chosen schedule in Step 6 by taking into considerations factors and requirements that were not considered in the initial scheduling procedure. | ||
| − | |||
| − | |||
The results of Burgess method is easily visualized with a resource-idelness graph that is simmilar to resource loading graph. The area covered by the resource idelness graph can be used as a measure of the effectiveness of the scheduling strategy employed for the project. Two scheduling strategies presented below yields the same project duration of 12 time units. | The results of Burgess method is easily visualized with a resource-idelness graph that is simmilar to resource loading graph. The area covered by the resource idelness graph can be used as a measure of the effectiveness of the scheduling strategy employed for the project. Two scheduling strategies presented below yields the same project duration of 12 time units. | ||
| Line 62: | Line 60: | ||
| − | As the Area of 1st strategy consists of more of the resource-time units than the Area of 2nd strategy. It is concluded that the 2nd strategy is more effective for resource utilization than strategy 1. | + | As the Area of 1st strategy consists of more of the resource-time units than the Area of 2nd strategy. It is concluded that the 2nd strategy that is leveled is more effective for resource utilization than strategy 1. Similar measures can be developed for multiple resources. However, for multiple resources; the different resource units must all be scaled to dimensionless quantities before computing the areas bounded by the resource idleness graphs. This assumes that all resources are equally costly or critical. If one resource is much more expensive, for example, it can be weighted to indicate the relative significance. |
Revision as of 21:05, 23 February 2018
Contents |
Abstract
The current business trends aim to achieve the operational excellence by maximizing the profit while minimizing the cost at the time. This has a profound impact on project managers forcing them to operate more and more efficiently. However, most of the project management systems used today tend to limit the efficiency due to the lack of data consistency and reliability. In consequence companies spend substantial amount of resources trying to standardize and integrate processes. As resources are needed by activities, activities produce products, products constitute projects, and projects make up organizations. Thus, resource management can be viewed as a basic component of the management of any organization. Integrating resources with schedule systems through resource loading, leveling or crashing allows to better utilize the assets and therefore help to predict the final outcome of the project more accurately.
Resource planning in the project management lifecycle
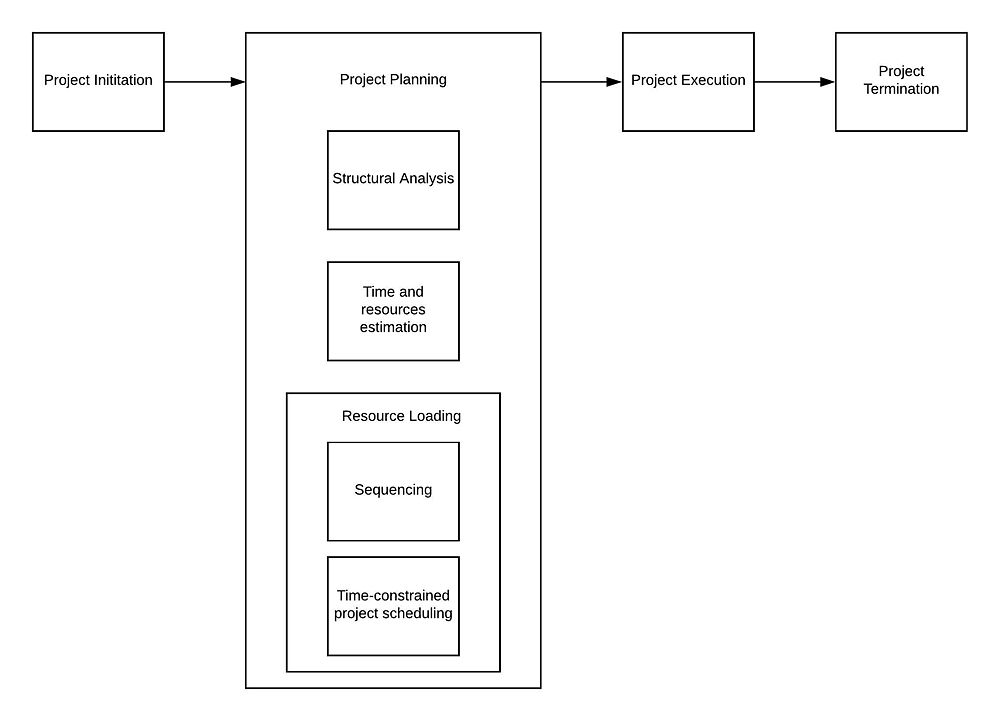
The lifecycle of the project consists of the 4 established stages: project initiation, project planning, project execution and closure(referene here?) Each phase in the project life cycle requires specific project management techniques.
Project planning at first decomposes the projects tasks into the order list of activities that are defined by structural analysis of the project such as Work Breakdown Structure (WBS). Each of the activities is later collated together with the time duration and resources requirements. Together they forms the project representation as a network modelling activities with the preceding activities before them. Based on resource availability and activities slack time, the initial starting time and deadlines are provided. Finally, the last step of project planning process consists of allocating the optimal resources over time for the successful activity execution. This is the most complex step in the project planning, which is why it became the common topic for many of the researches.
Basic Scheduling techniques in Project Management such as The Critical Path Method (CPM) or PERT assume the unlimited resource availability in the project network. In reality, both the time and resource requirements need to be properly allocated while developing network schedules. Projects are subjected to three major constraints:
- Time limitation
- Resource availability
- Performance requirements
Satisfying all three criteria at the same time are difficult to perform without trade-offs. That has risen a need for project progress control methods that could deal with these inconsistencies in a project schedule.
Resource Loading
Resource loading identifies the amount of project resources required over the project lifecycle. The critical point of this method is that there are definite limitations on the amount of resources available to carry out the project (under consideration. Due to that fact, the project duration may increase beyond the initially estimated end-date. The overall objective of resource loading is to minimize the duration of the project being scheduled subjected to the stated constraints on available resources.
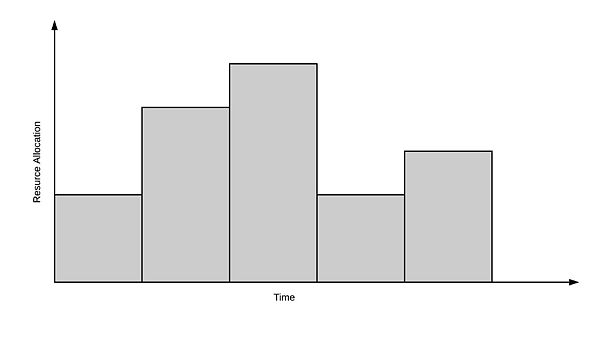
Resource loading can be conveniently presented as the graphical representation of resource allocation over time. This gives an indication of the demand a project will take place on the organization's resources.
The graph can be adapted to show number of critical information () regarding the project plan such as:
- Variation in the resource allocation overtime provides information about the depletion rate
- Show areas of resource conflicts when presenting the allocation of various resources
- Show the level of load on the resource if it was assigned to different activities at once
Resource Leveling
Resource leveling is the optimization technique used to adjust the schedule model to the demand and supply fluctuations. adapt the start ad finish dates based on the resource constraints with the goal of balancing demand for resources with the available supply. The method can be used when the required resources are available only during certain period or in limited quantity or. It is also used to balance the resource consumption level. [1]
Burgess Method
A systematic procedure for levelling resources was developed by Burgess and Killebrew in 1962. The so-called Burgess method utilizes a simple measure of effectiveness given by the sum of squares of the resource requirements for each of the activities in the project schedule. While the sum of resource requirements over the project duration is fixed, the sum of squares of resource-units requirements decreases as the peaks and valleys are levelled.
- List the project activities in the preceding order. Add to the list duration, early start and a relevant slack for each activity.
- Start with the last activity, schedule it to give the lowest sum of squares of resources requirements for each time unit. If more than one schedule gives the same total amount of squares, schedule the activity as late as possible to provide more slack to the preceding activities.
- Fix the last modified activity and proceed wit Step 2 to the next last activity in the network, taking advantage of slack available after the previous step.
- Continue with the previous step until the 1st activity of the list is reached. Once the 1st activity is rescheduled, the first reschedule cycle is complete.
- Continue with additional rescheduling cycles repeating steps from 2 to 4 until no further reduction in total sum of squares od resource requirements can be made.
- Choose the best schedule obtained.
- Make final adjustments to the chosen schedule in Step 6 by taking into considerations factors and requirements that were not considered in the initial scheduling procedure.
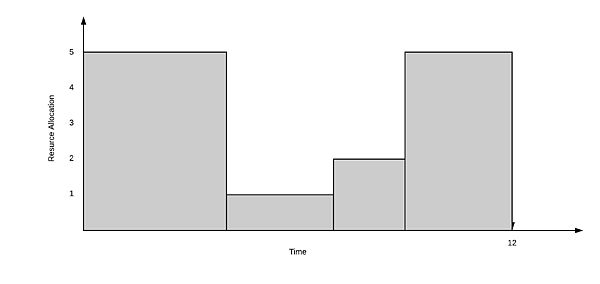
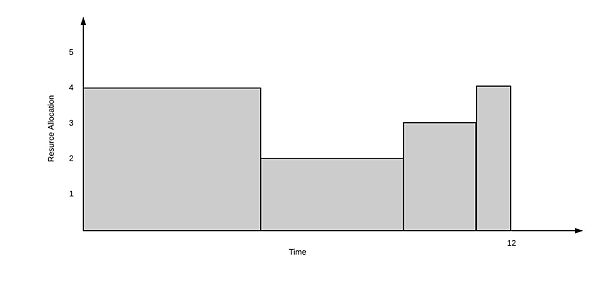
The results of Burgess method is easily visualized with a resource-idelness graph that is simmilar to resource loading graph. The area covered by the resource idelness graph can be used as a measure of the effectiveness of the scheduling strategy employed for the project. Two scheduling strategies presented below yields the same project duration of 12 time units.


To compare these a measure of the resource utilization under each strategy will be performed for each of the resource-idleness graph . The effective area is calculated as following:


As the Area of 1st strategy consists of more of the resource-time units than the Area of 2nd strategy. It is concluded that the 2nd strategy that is leveled is more effective for resource utilization than strategy 1. Similar measures can be developed for multiple resources. However, for multiple resources; the different resource units must all be scaled to dimensionless quantities before computing the areas bounded by the resource idleness graphs. This assumes that all resources are equally costly or critical. If one resource is much more expensive, for example, it can be weighted to indicate the relative significance.
Advantages of resource leveling include simplified resource tracking and control, low cost of resource management and increased opportunity for learning. However, acceptable resource leveling is typically obtained at the expense of longer project duration.
Crashing
Crashing is a method used to analyze and choose the most cost-efficient measurements of compressing the project duration.[2] Crashing is a schedule compression technique used to meet schedule constraints, dates and other objectives without compromising the project scope. This can be done by utilizing extra resources like: approving overtime hours, bringing the additional resources or expediting delivery of activities to the reach the critical path.

