Optimizing Contracting Strategies
(→Gant Chart in Project Management) |
|||
| Line 30: | Line 30: | ||
===Value Proposition Canvas - Clara WIP=== | ===Value Proposition Canvas - Clara WIP=== | ||
| − | For further information refer to the following DTU wiki | + | For further information refer to the following DTU wiki [http://wiki.doing-projects.org/index.php/Value_Proposition_Canvas|link]. |
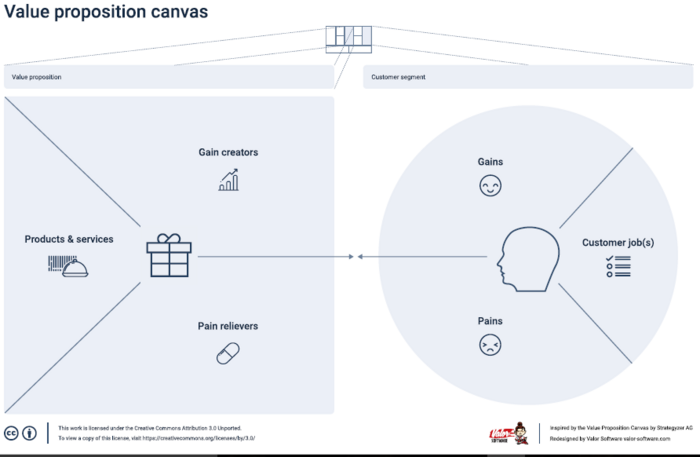
[[File:Value Proposition Canvas.PNG|thumb|Value Proposition Canvas, adopted from ''Strategyzer.com'' <ref name="Strategy"/>|700px]] | [[File:Value Proposition Canvas.PNG|thumb|Value Proposition Canvas, adopted from ''Strategyzer.com'' <ref name="Strategy"/>|700px]] | ||
| − | ==Maslow hierarchy of needs - Clara WIP== | + | ===Maslow hierarchy of needs - Clara WIP=== |
==Complexity== | ==Complexity== | ||
Revision as of 15:08, 18 February 2020
In order to manage successfully a project, certain perspectives need to be covered.
- Purpose
- People
- Complexity
- Uncertainty
This article briefly explains the tools that can be used to analyze each perspective.
Contents |
Purpose
Vision Statement
SMART goals
Project Charter
Value Proposition Canvas
Project governance framework
Business Case
Key Performance Indicators (KPI)
This tool represents a quantitative measurement of a company's efficiency. It evaluates their success at achieving key business objectives and reaching specific targets. KPIs can be applied of different level, depending on the process they focus on. These assessments frequently help identify potential improvements, which then often lead to initiatives to improve performance.
People
Value Proposition Canvas - Clara WIP
For further information refer to the following DTU wiki [1].

Maslow hierarchy of needs - Clara WIP
Complexity
Complexity happens when too many parts come together and it becomes difficult to structure and organize the activities, portfolio and cost flows. In order to manage the situation, the first step to take would be trying to break down the main tasks. Once smaller tasks are gathered, it will be easier to focus on their complexity individually. It is convenient to break down each task as much as possible so even if this will create many starts treating them as smaller individual tasks.
The following tools are used to break down the situation.
Contracting and procurement
Gant Chart in Project Management
A Gantt Chart is a timeline management tool to illustrate how a project will be running. Thanks to the tool it is possible to view individual tasks, their durations and the sequencing of these tasks. Also, it is very useful as it illustrates the overall view of the timeline of the project and the expected completion dates of each phase.
One of the several benefits of using Gant Charts in Project Management is the possibility to run the project with greater efficiency with improved either cost and time outcomes Basically, a Gantt chart provides a graphical illustration of a schedule that helps to plan, coordinate, and track specific tasks in a project. Thus, in order to be able to build a valid model these are the steps that must be taken:
Step 1: Identify Essential Tasks
===Step 2:=== Identify Task Relationships: These dependent activities are called "sequential" or "linear" tasks. Other tasks will be "parallel”.
===Step 3:=== Input Activities Into Software Or a Template: there are many programs that help us build Gant chart like Microsoft Project, for instance.
===Step 4:=== Chart Progress: the chart needs to be updated in order to reflect changes as soon as they occur
Uncertainty
The Triple Constraint in Project Management
Cite error:
<ref> tags exist, but no <references/> tag was found