Successful Project Management
Anaskoutsou (Talk | contribs) |
Anaskoutsou (Talk | contribs) |
||
| Line 151: | Line 151: | ||
==Gantt Chart== | ==Gantt Chart== | ||
| − | [[File:GC1.PNG| | + | [[File:GC1.PNG|380px|thumb|right|Gantt Chart Example]] |
A Gantt chart is a project management tool created in 1917 by Henry Gantt that can be used simply on a paper, or in Excel for more complex projects. It is a horizontal bar chart and its main advantage is that it provides a full insight on all the tasks and the clear schedule. What makes it extremely useful to the project management sector, is that it provides a clear understanding of the planning and coordinating as well as deadlines and timeframes. To be more precise, the horizontal axis represents the time span, while the vertical axis the tasks. The horizontal rectangles are showing the time span or the deadline for each one of the tasks. When the rectangle is dotted, it indicates that the task is completed and when the rectangles are overlapping it means that two tasks that require less time, can be completed at the same time. A vertical dotted line is added when a report date is established. | A Gantt chart is a project management tool created in 1917 by Henry Gantt that can be used simply on a paper, or in Excel for more complex projects. It is a horizontal bar chart and its main advantage is that it provides a full insight on all the tasks and the clear schedule. What makes it extremely useful to the project management sector, is that it provides a clear understanding of the planning and coordinating as well as deadlines and timeframes. To be more precise, the horizontal axis represents the time span, while the vertical axis the tasks. The horizontal rectangles are showing the time span or the deadline for each one of the tasks. When the rectangle is dotted, it indicates that the task is completed and when the rectangles are overlapping it means that two tasks that require less time, can be completed at the same time. A vertical dotted line is added when a report date is established. | ||
Revision as of 10:46, 25 February 2020
Building 310
Abstract
Meeting Strategies
A meeting can be defined in many ways, one of which is: “a focused interaction of cognitive attention, planned or chance, where people agree to come together for a common purpose, whether at the same time and the same place, or at different times in different places” [1]. Or as Kayser defines: “A meeting is a gathering where people speak up, say nothing, and then all disagree” Cite error: Invalid <ref> tag;
refs with no content must have a name . The last definition indicates how unproductive and unconstructive meetings can be. In fact, research shows that even though managers spend more than 50% of his/her official work time in meetings, many meetings fail and cause great and unnecessary costs on wasted working time.
However, meetings can be very essential for larger groups of people working together, in order to agree upon key project management activities such as scheduling, cost, and quality. For this reason good meeting strategies can be helpful and in some cases necessary. There are many tools which can be applied in order to make meetings more efficient, and in this article some of the most common ones are explained.
Making meetings time efficient
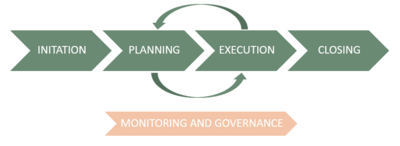
Meetings will run throughout the whole project, but according to when the meeting is held there are different things to take into account. The project manager is responsible for facilitating the meetings and for identifying which challenges will be, or can be, met in different phases in order to achieve the overall goal of the project. One useful method is to make a model of the project phases and to identify possible challenges in each phase. One example of such a model can be seen in the figure to the right.
The project phase model is unique for every project, but usually the project goes through four phases: (1) Initiation (2) Planning (3) Execution (4) Closing. Each phase has different associated management activities [2].
Another tool which can be used together with the project phase model is to identify the costs throughout the whole project’s life cycle. In most projects the costs will be low in the beginning (Initiation) and will start to increase from the end of the planning phase (REferer til PMI her). It is important to make the meetings as efficient as possible when the costs are high, which such a model can help you identify.
A collection of tools for meeting strategies
Avoid unnecessary meetings
First of all it is important to avoid unnecessary meetings. This is especially important when the costs are high and the time is scarce, since people are not fond of wasting their time and this will cause higher costs. A good method is therefore to set up some guidelines for when it is acceptable to call a meeting in order to avoid unnecessary meetings. There are a couple of things that indicates when a meeting is needed [3] which are listed below:
- When unresolved issues are inhibiting the progress of a project or interdependent projects
- Decision making
- Idea generation
- Distribution of a compelling agenda prior to the meeting
- Celebration of reaching a milestone
Sometimes there is a need for communication, but a meeting is not necessary. In many cases this concerns the type of communication where only one person needs to speak (often the project manager). Examples of this type of communication are updates, delivery of information and presentations.
Plan the meeting in advance
Another important tool is to plan the meeting in advance. This both concerns the aspect of when and where the meeting should be held, but also which specific topics should be discussed at the meeting. These two aspects should be announced in good time to all attending the meeting, so that they are able to prepare.
Meeting minutes
Another good tool is meeting minutes. These contains important information from the meetings and are saved in the project management plan Referer til PMI her. It is a good idea to agree on a structure of the minute so that it takes the same structure for each meeting. The meeting minute is useful for people who could not attend the meeting to see what was discussed, to be able to go back in time and see what was discussed and agreed upon, but also to help keep a structure of the meeting..
The tools mentioned above are just a few among many. Other useful tools could be looking at you create valuable meetings and encourage the participation in meetings
Team development
Team development is part of what is called project resource management, which includes the processes to identify, acquire, and manage the resources needed for the successful completion of the specific project Cite error: Invalid <ref> tag;
refs with no content must have a name . These processes consist of (1) Plan Resource Management (2) Estimate Activity Resources (3) Acquire Resources (4) Develop Team (5) Manage Team (6) Control Resources. All these processes help to ensure that the right resources will be available at the right time and place Cite error: Invalid <ref> tag;
refs with no content must have a name .
The fourth process, Team Development is about improving the competencies, the interaction between team members and the overall environment of the team to enhance project performance Cite error: Invalid <ref> tag;
refs with no content must have a name. Different sources [4] and Cite error: Invalid <ref> tag;
refs with no content must have a name agree that teams are developed through four stages - called the FSNP model: Forming - Storming - Norming - Performing. First of all the team members meet and learn about the project and their formal roles and responsibilities. In the second stage the team begins to address the project work, technical work and the management approach. It is important that the team members are open to different ideas and perspectives at this point, otherwise the environment can become counterproductive. In the third stage the team starts to work together and they adjust their behaviors to support the team. Not all teams reach the last stage, since this requires a well-functioning unit. In this stage the team is independent and works through issues smoothly and effectively Cite error: Invalid <ref> tag;
refs with no content must have a name.
Teamwork is a critical but important factor for project success which is why developing effective and dynamic teams is one of the primary responsibilities for the project manager. Six behaviors have been noticed to affect a high team performance:
- Using open and effective communication,
- Creating team-building opportunities,
- Developing trust among team members,
- Managing conflicts in a constructive manner,
- Encouraging collaborative problem solving, and
- Encouraging collaborative decision making.
Furthermore, it improves the performance if the team members get to know each other
A clear result of this is that it improves teamwork which in most cases leads to an improved completion of the project. Furthermore it strengthens personal skills and motivates the employees.
Project Stakeholder Management
Stakeholders can be defined as people, groups or organizations which could impact or be impacted by the considered project Cite error: Invalid <ref> tag;
refs with no content must have a name . In a project the stakeholders could for instance be the owners, client and purchaser, but may as well be the project team, architect or a local community. These are just a few examples.
Stakeholder management deals with analyzes of the stakeholders expectations and their impacts on the project/program/portfolio. Furthermore it is about developing an appropriate strategy for effectively engaging stakeholders in project decisions, and the planning and execution of the work Cite error: Invalid <ref> tag;
refs with no content must have a name. It is an important and useful tool for reducing complications and altercations. Some would even state that “The ability of the project manager to correctly identify and manage these stakeholders in an appropriate manner can mean the difference between success and failure” Cite error: Invalid <ref> tag;
refs with no content must have a name.
The Project Stakeholder Management can be divided into four processes:
- Identifying Stakeholders
- Plan Stakeholder Management
- Manage Stakeholder Engagement
- Monitor Stakeholder Engagement
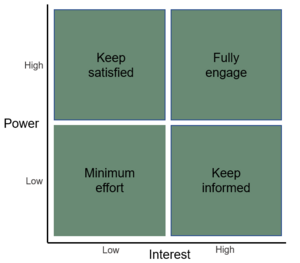
Before engaging any stakeholders in your project, you need to identify and analyze them in order to place them in appropriate groups. This is the first process and will help you develop the right plan for communicating with the different types of stakeholders throughout the project [5]. The analysis of the stakeholders means placing them in categories according to their interests and their power. A possible division could be as illustrated in the Power/Interest Matrix to the right.
As illustrated in the Power/Interest Matrix each stakeholder category requires different treatments in order to keep them engaged in the project.
The next process is to plan the stakeholder engagement which is the process of developing approaches to involve stakeholders based on their needs, expectations, interests and potential impacts on the project Cite error: Invalid <ref> tag;
refs with no content must have a name. This is important in order to interact effectively with stakeholders. The plan can be developed in the beginning of a project, but should be reviewed and corrected throughout the project. This plan should at least consist of a resource management plan, communication management plan and a risk management plan.
The third process of the Project Stakeholder Management is the process of communicating and working with the stakeholders to meet their needs and expectations, address issues, and foster appropriate stakeholder involvement Cite error: Invalid <ref> tag;
refs with no content must have a name. Working with the stakeholders allows the project manager to increase the support and minimize the resistance from stakeholders. This requires different tools and techniques such as communication skills, conflict management, political awareness, negotiation skills and many more.
The final process is the monitoring of stakeholder engagement in which the project stakeholder relationships are monitored and strategies are tailored for engaging stakeholders through modification of engagement strategies and plans Cite error: Invalid <ref> tag;
refs with no content must have a name. The purpose of this process is to either maintain or increase the efficiency and effectiveness of the stakeholder engagement activities as the project evolves and possibly changes. This process should be performed throughout the whole project. Also this process requires different tools such as decision making tools, data analysis and interpersonal and team skills.
The Triple Constraint in Project Management
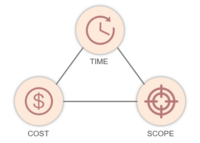
The triple constraint in Project Management is often referred to as the Iron Triangle, where the three corners represent the triple constraints: time, cost and scope.
It is important to establish the goals and requirements (the scope) in the beginning of the project. By defining the scope of the project, you ensure that everybody is working towards the same goal and knows how the final deliverable should turn out. If a clear scope for the project is not defined - and documented - a lot of minor add-ons can end up turning the final deliverable into a completely different project than intended. Additional features can also result in changes in the budget and time constraints as you have to increase the project cost by e.g. assigning more people to the project or extending the project time frame. Constant awareness of changes in the project scope gives you the possibility to discuss the trade-offs within the triple constraints and thereby adjust the changes and thereby keeping the project on track [6].
A detailed description of the project scope can be a good foundation for the overall understanding of the time constraint, as an estimate of the project can be made. If you want the project to be done before time it will probably cost you if you are not willing to lack on the project requirements established in the scope, as a short deadline requires extra resources in order to get the wanted work done in the wanted quality. The establishment of the project time frame can thereby form the basis for the project costs.
The triple constraint in project management is focusing on the output in the management expressed by operating within a set of boundaries consisting of the project time cost and scope. This means that changes in one of the factors will affect the outcome of the two other factors. The triple constraints therefore need to be balanced, as it all depends on trade-offs, in order to achieve a successful project.
Key Performance Indicators
In order to determine if the project is on track Key Performance Indicators (KPI’s) can be used. KPI’s makes the performance of the project measurable by providing a value, that indicates how effectively the project is at the given moment compared to the project scope. In order to get a measurable performance indicator, the person in charge of the project (project manager) typically chooses some key points (about 2-5) concerning the project objectives, effort and cost and/or the project performance[7].
Scope Control
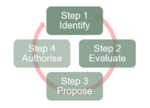
In order to control a project scope control must be handled. Scope Control processes makes it possible to identify possible conflicts in connection with the approved Project Scope Statement and thereby to manage these conflicts. In order to manage Scope control implemented changes of the scope must be identified, evaluated, proposed and then authorised. Always ensuring the scope of the projects is considered very important when managing project changes throughout the project life cycle, as changes may cause changes in the deliverables and thereby the functionality, resources needed and overall completion of the project.
Earned Value Analysis
In order to ensure the project progress Earned Value Management can be used to indicate the overall performance of the project. An Earned Value Analysis is based on the comparison of the work performed and the work planned and can thus be used as cost (CPI) and schedule (SPI) control in project forecasting. By the use of EVM decision making can be simplified, as it provides quantitative data, that can easily be communicated[8].
Scenario analysis
In order to identify the risks in a project different tools, such as Scenario Analysis, can be used. The Scenario Analysis is used to analyze future events with different outcomes in order to present several developments from the given project. This analysis does not rely on any past data or observations but should take all scenarios to be plausible. By making a scenario analysis at the beginning of the project the risk can be easily identified and thereby managed throughout the project phases[9].
Risk Matrix
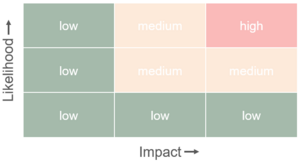
A risk matrix can be used for assessing the risks of the project by defining the level of the risks by its impact and likelihood.
Value Proposition Canvas
Classically the value proposition canvas has two sides. The customer profile you clarify in which way you understand your customers' needs. While the value proposition describes your intention to create value for your customers. The optimal starting position for each company is the fit between these two requests (Value Proposition Design: How to Create Products and Services Customers Want).
Customer Profile
- Gains: the benefits which the customer expects and needs, what would delight customers and the things which may increase the likelihood of adopting a value proposition.
- Pains: the negative experiences, emotions, and risks that the customer experiences in the process of getting the job done.
- Customer jobs: the functional, social and emotional tasks customers are trying to perform, problems they are trying to solve and needs they wish to satisfy.
Value Proposition
- Gain creators: how the product or service creates customer gains and how it offers added value to the customer.
- Pain relievers: a description of exactly how the product or service alleviates customer pains.
- Products and services: the products and services which create gain and relieve pain, and which underpin the creation of value for the customer.
SWOT Analysis
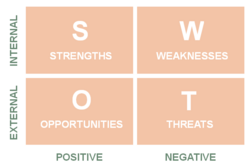
The SWOT analysis tool is a decision-support tool that consists of four main sectors that go as “Strengths”, “Weaknesses”, “Opportunities” and “Threats”. Through the process of this analysis the steps are:
- The stakeholders identify the factors inside an organization, increasing (strengths) or decreasing (weaknesses) its performance.
- The stakeholders further investigate the factors outside an organization’s structure, growing (opportunities) or reducing (threats) its performance.
When all the information about the four aforementioned factors are gathered, the analysis procedure begins, to determine the effects all the factors have on the net value of the organization and the ways they can control it. In order to eliminate the negative effects of weaknesses and threats, not only presently but in the future as well, in many cases, scenario planning is implemented. Finally, based on the results of these procedures, future plans and actions are established. More specifically, different strategies are being followed, based on the missions and goals the organization has set. Those strategies should have as their main focus to evolve strengths, eliminate weaknesses, use the opportunities wisely and respond effectively to threats.
Design Thinking
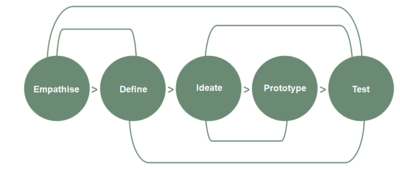
Design thinking is a tool that processes the potential issues an organization has and redefines them in order to differentiate the strategies and simplify them, evolving around who the design of the product or service is for. The main aim of this tool is the solution itself by combining thinking and brainstorming with hands-on procedures. Design thinking is extremely useful when it comes to avoiding faults since its main goal is to redefine problems based on humans and the way they are thinking. Some of the most commonly used techniques in order to implement a design-oriented way of thinking is sketching and conceptualization, as well as testing those to analyze the derived outcomes and the effect they have on the people they are made for.
The steps followed when using "Design Thinking" as a tool are:
- "Empathise", meaning that the person who is trying to solve the problem understands it deeply. A thorough investigation of the area of concern is vital in order to reach the root of the problem and its causes. Since design thinking is a human-centered procedure, empathy is a key to it.
- "Define", meaning that the clear problem has to be defined and established in order for the next steps to be implemented. The more clarity in the problem definition, the more helpful it is for the following steps.
- "Ideate", is the part when the generation of ideas and brainstorming is taking place. At this stage, it is not a matter of the quality of the ideas, but more about the quantity.
- "Prototype", where a maquette is created in order for the people to be able to implement some of the most ambitious ideas from the previous step and see the effects on the scaled-down product.
- "Test" the completed program using the best solution deriving from the previous phase. Alterations may occur after this step since all the faults will be identified.
As can be seen in the figure above, during the design thinking the interaction of all the stages is not linear and the stages may take place in a different order than shown.
Gantt Chart
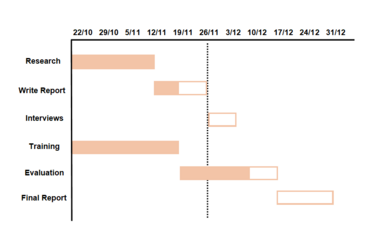
A Gantt chart is a project management tool created in 1917 by Henry Gantt that can be used simply on a paper, or in Excel for more complex projects. It is a horizontal bar chart and its main advantage is that it provides a full insight on all the tasks and the clear schedule. What makes it extremely useful to the project management sector, is that it provides a clear understanding of the planning and coordinating as well as deadlines and timeframes. To be more precise, the horizontal axis represents the time span, while the vertical axis the tasks. The horizontal rectangles are showing the time span or the deadline for each one of the tasks. When the rectangle is dotted, it indicates that the task is completed and when the rectangles are overlapping it means that two tasks that require less time, can be completed at the same time. A vertical dotted line is added when a report date is established.
The advantages deriving from the Gantt Chart are:
- It is an easy and clear way to showcase all the tasks and milestones of a project.
- Enables efficient time management by offering access to all the different dates and deadlines and adjusting to any time span.
- Offers a clear picture of every team member's tasks.
- Provides an insight into the percentage of the tasks and the amount and status of tasks that are nearly or entirely completed.
- Makes it easier and more sufficient to manage and coordinate the team by having everything illustrated at one place.
Dealing with conflict in project management
The procedure of analyzing the conflicts becomes very simple if looking at Friedrich Glasl's model of conflict escalation. This model contributes to identifying the conflict at an early stage and being able to dissolve it before it gets dangerous to the people but also to the project itself. Looking at the model, every conflict will evolve through some known steps, while each step represents its own dynamics.
How to wiki
How to add a reference?
Do it in the text like this:
write [10]
Refer to the same reference again by writing: Cite error: Invalid <ref> tag;
refs with no content must have a name
It automaticly print it under References :-)
How to add a picture: Click on the botton "Upload file" on the left. Give the file a name you can remember Go into the wikipage to edit. write: [File:name.jpg|300px|thumb|right|picture text]
Application
Limitations
Annotated Bibliography
References
- ↑ Romanco, N. and Nunamaker, J. (2001) Meeting Analysis - Findings from Research and Practice. Proceedings of the 34th Annual Hawaii International Conference on System Science, http://citeseerx.ist.psu.edu/viewdoc/download?doi=10.1.1.570.6650&rep=rep1&type=pdf
- ↑ Project Management Institute, Inc. (2017). Guide to the Project Management Body of Knowledge (PMBOK® Guide) (6th Edition), https://app.knovel.com/hotlink/toc/id:kpGPMBKP02/guide-project-management/guide-project-management
- ↑ Rogelberg, S. & Scott, C. & Kello, J. (2007) The Science and Fiction of Meetings - MIT Sloan Management Review - Volume 48(2), https://orgscience.uncc.edu/sites/orgscience.uncc.edu/files/media/Rogelberg%20et%20al.%20-%202007%20-%20The%20science%20and%20fiction%20of%20meetings.pdf
- ↑ Stott, K. & Walker, A. (1995) Teams Teamwork & Teambuilding
- ↑ MacDonald, J., Business2Community (2016) Stakeholder Identification and Analysis Made Easy for Project Managers, https://www.business2community.com/strategy/stakeholder-identification-analysis-made-easy-project-managers-01440041
- ↑ Van Wyngaard, C.J., Pretorius, J. H. C., Pretorius, L. (2012). Theory of the triple constraint – a conceptual review, IEEE International Conference on Industrial Engineering and Engineering Management
- ↑ Klipfolio Inc. (2020). What is a KPI? Measure your performance against key business objectives, https://www.klipfolio.com/resources/articles/what-is-a-key-performance-indicator//
- ↑ Warburton, Roger David Hand (2008). The practical calculation of schedule variance in terms of schedule, https://www.pmi.org/learning/library/practical-calculation-schedule-variance-7028//
- ↑ Wikipedia (2019). Scenario analysis, https://en.wikipedia.org/wiki/Scenario_analysis//
- ↑ Author (year) title, link
