Femern
(/* Estimation of Cost: Bottom-Up Estimatinghttps://app-knovel-com.proxy.findit.dtu.dk/web/view/khtml/show.v/rcid:kpGPMBKP02/cid:kt011DX7BB/viewerType:khtml//root_slug:6-project-schedule-management/url_slug:project-schedule-management?kpromoter=fed...) |
|||
| Line 61: | Line 61: | ||
from Theory to Practice. ''Journal of Construction Research'', Vol. 3, No. 1, 1-16. </ref>. | from Theory to Practice. ''Journal of Construction Research'', Vol. 3, No. 1, 1-16. </ref>. | ||
|- | |- | ||
| − | |||
! scope="col"| Pros | ! scope="col"| Pros | ||
! scope="col"| Cons | ! scope="col"| Cons | ||
| − | + | ||
|- | |- | ||
| Conceptualization of production: | | Conceptualization of production: | ||
| Line 92: | Line 91: | ||
|- | |- | ||
|} | |} | ||
| − | |||
| − | |||
==Communications Management== | ==Communications Management== | ||
Revision as of 13:03, 6 March 2020
Contents |
Project Quality Management
Plan Quality Management: Data Analysis[1]
Data Analysis is one of the tools used for Plan Quality management. There are two major techniques used for Data Analysis, which are cost-benefit Analysis and cost of quality.
Cost-benefit Analysis is used for analysis of alternatives, and help determine the most beneficial alternative. This is done by estimating the strengths and weaknesses of the alternatives
Cost of quality can help the company keep high quality and thereby lead to savings. Cost of quality consist of three costs.
Prevention costs are costs used to prevent poor quality. Appraisal costs are costs for appraisal, such as evaluating and testing products, deliverables or services. Failure Costs are costs linked to failure in products, deliverables or services.
Manage Quality: Data Representation[1]
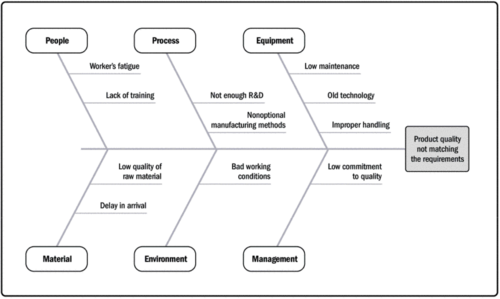
Data Representation is used to show data of an organization. They can among others, show issues and defect in certain areas, which needs more attention. Data Representation is mostly illustrated as a diagram or chart. Types of data representation includes affinity diagram, cause-and-effect diagram, flow chart and histogram.
Schedule Management
Estimation of Activity Durations: Three-Point Estimating[2]
Three-point estimating is a tool used to estimate the duration of an activity. It is used primarily when there is insufficient historical data available to produce an estimate. The tool considers a most likely time (tM), optimistic time (tO) and pessimistic time (tP) to produce the best estimate via the following equation:
tE = (tM + tO + tP)/3
Using this triangular distribution estimation uncertainty and risk can be reduced with respect to single-point estimating. Total project duration may then be estimated by finding the summation of individual activity durations through an integrated activity execution flow chart (e.g. Gantt chart).
Development of a Schedule: Critical Path Method[2]
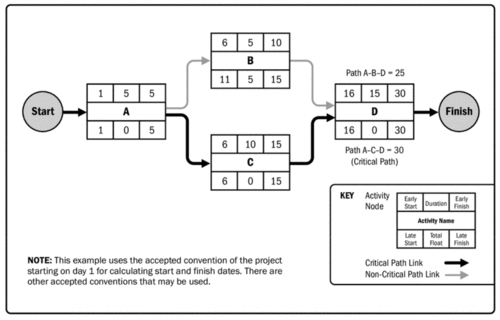
The critical path method is used to produce to calculate the minimum project duration and the amount of schedule flexibility available on the logical network paths within the schedule model. The analysis calculates the early and late start and finish dates of each activity using activity duration estimates. Using the scheduled activity network, the longest activity path (namely 'critical path') is then computed (see path 'ACD' Figure 3). This is used as the project duration estimate. The 'float' of activities not on the critical path is determined, defined as the maximum duration the activity can be delayed by without delaying the project as a whole. This is used to determine the schedule flexibility within the schedule model.
Cost Management
Estimation of Cost: Bottom-Up Estimating[2]
A method used putting the activity of a project into more details. As the name indicates it goes from the bottom and upwards, meaning that the expected costs are accounted for at the highest level of detail. There are pros and cons of using this method. Pros: Accurate results are gained (project cost will become very close to the estimated cost) Cons: The method is very timeconsuming The method requires project managers with experience about a certain field
| Table 1: TFV model of production. The table is based on a table in Koskela (2002)[3]. | |||
| Pros | Cons | ||
|---|---|---|---|
| Conceptualization of production: | As a transformation of inputs into outputs | As a flow of material, composed of transformation, inspection, moving and waiting | As a process where value for the customer is created through fulfillment of his/her requirements |
| Main principle: | Getting production realized efficiently | Elimination of waste (non-value-adding activities) | Elimination of value loss (achieved value in relation to best possible value) |
| Methods and practices: | Work breakdown structure, MRP, organizational responsibility chart | Continuous flow, pull production control, continuous improvement | Methods for requirement capture, quality function deployment |
| Practical contribution: | Taking care of what has to be done | Making sure that unnecessary things are done as little as possible | Taking care that customer requirements are met in the best possible manner |
| Suggested name of practical application of the view: | Task management | Flow management | Value management |
Communications Management
Plan Communications Management: Communication Technology[4]
Communication Technology is a tool used to properly plan the method of sharing information among stakeholders.
Different platforms may be used to accomplish this, such as conversations, minutes of meetings (MOM), written documents and social media. Some factors should be considered in order to define the best communication method for a specific topic:
- Urgency, frequency and format
- Compatibility, availability and easy to access among all stakeholders
- Project enviroment (Face-to-face or virtual based)
- The sensitivity and confidentiality of the information
Furthermore, the communication channels may vary within each project phase.
Bibliography
- ↑ 1.0 1.1 https://app-knovel-com.proxy.findit.dtu.dk/web/view/khtml/show.v/rcid:kpGPMBKP02/cid:kt011DXC52/viewerType:khtml//root_slug:8-project-quality-management/url_slug:project-quality-management?kpromoter=federation&b-toc-cid=kpGPMBKP02&b-toc-root-slug=&b-toc-url-slug=project-quality-management&b-toc-title=Guide%20to%20the%20Project%20Management%20Body%20of%20Knowledge%20(PMBOK®%20Guide)%20(6th%20Edition)&page=1&view=collapsed&zoom=1
- ↑ 2.0 2.1 2.2 https://app-knovel-com.proxy.findit.dtu.dk/web/view/khtml/show.v/rcid:kpGPMBKP02/cid:kt011DX7BB/viewerType:khtml//root_slug:6-project-schedule-management/url_slug:project-schedule-management?kpromoter=federation&b-toc-cid=kpGPMBKP02&b-toc-root-slug=&b-toc-url-slug=project-schedule-management&b-toc-title=Guide%20to%20the%20Project%20Management%20Body%20of%20Knowledge%20(PMBOK%C2%AE%20Guide)%20(6th%20Edition)&page=1&view=collapsed&zoom=1
- ↑ Koskela, L.; Huovila, P.; Leinonen, J. (2002). Design Management in Bilding Construction: from Theory to Practice. Journal of Construction Research, Vol. 3, No. 1, 1-16.
- ↑ https://app-knovel-com.proxy.findit.dtu.dk/web/view/khtml/show.v/rcid:kpGPMBKP02/cid:kt011DXH02/viewerType:khtml//root_slug:10-project-communications-management/url_slug:project-communications?kpromoter=federation&b-toc-cid=kpGPMBKP02&b-toc-root-slug=&b-toc-url-slug=project-communications&b-toc-title=Guide%20to%20the%20Project%20Management%20Body%20of%20Knowledge%20(PMBOK%C2%AE%20Guide)%20(6th%20Edition)&page=1&view=collapsed&zoom=1

