Construction of the new Storstroem Bridge
Johanknudsen (Talk | contribs) (→Changes Within the Project) |
Johanknudsen (Talk | contribs) (→Reference Class Forecasting) |
||
| (12 intermediate revisions by one user not shown) | |||
| Line 70: | Line 70: | ||
== Triple Constraint Theory == | == Triple Constraint Theory == | ||
| − | [[File:TSC.png|right|thumb|250px|Figure | + | [[File:TSC.png|right|thumb|250px|Figure 2: Shows the Iron triangle and the three constraint categories from <ref name= "The Triple Constraints in Project Management">http://wiki.doing-projects.org/index.php/The_Triple_Constraint_in_Project_Management visited 03-03-2020</ref>]] |
| − | + | It is inevitable to avoid constraints when doing projects. These constraints can be categorized into three categories which are scope, cost and time. These categories form the base of the iron triangle which is also called the triple constraint theory. An illustration of the iron triangle can be found in figure 2 to the right. | |
| − | According to ISO standard 12500 states that a change in one of the constraints will affect the others. | + | According to ISO standard 12500 states that a change in one of the constraints will affect the others. Therefore, the principle of the iron triangle is that you can prioritize or focus on two out three constraint categories in the iron triangle leaving the third to be determined based on your choices with the two constraints. |
| − | + | ||
| − | + | One of the limitations of applying the iron triangle is that there is a chance that you are underestimating the complexity of the project by simplifying it to a simple overview. This is a limitation since it could shift the focus from the origin of the project. | |
== Management Reserves Vs. Contingency Reserves == | == Management Reserves Vs. Contingency Reserves == | ||
| Line 86: | Line 86: | ||
== PESTEL Analysis == | == PESTEL Analysis == | ||
| − | [[File:PESTEL.PNG|right|thumb|250px|Figure | + | [[File:PESTEL.PNG|right|thumb|250px|Figure 3: Shows the factors included in a PESTEL analysis <ref name= "PESTEL Analysis" >https://www.professionalacademy.com/blogs-and-advice/marketing-theories---pestel-analysis visited 03-03-2020</ref>]] |
| − | A PESTEL analysis is an extended version of the PEST analysis and it contains political, economic, social, technological, environmental and legal aspects. The manager can apply this to analyze and monitor macro-environmental factors that may have an impact on the organization. A PESTEL analysis is often applied in combination with a SWOT analysis where you are looking at strengths, weaknesses, opportunities, and threats to a company or a special case of the company. | + | |
| + | A PESTEL analysis is an extended version of the PEST analysis and it contains political, economic, social, technological, environmental and legal aspects. The manager can apply this to analyze and monitor macro-environmental factors that may have an impact on the organization. A PESTEL analysis is often applied in combination with a SWOT analysis where you are looking at strengths, weaknesses, opportunities, and threats to a company or a special case of the company. An illustration of the PESTEL analysis can be found in figure 3 to the right. | ||
The political factor is the degree to which the government intervenes with a specific industry. The initiatives could, for instance, be; tax increment/decrease, laws, and regulation (including laws to protect the environment). | The political factor is the degree to which the government intervenes with a specific industry. The initiatives could, for instance, be; tax increment/decrease, laws, and regulation (including laws to protect the environment). | ||
| − | The economic factors include economic growth, interest rates, inflation, unemployment rates, | + | The economic factors include economic growth, interest rates, inflation, unemployment rates, etc. The economic factor influences the purchasing power of a company. |
| − | The social factors include norms and cultural aspects, the value of customers, demographics. The social factor includes factors like the growth rate of the population, income and the distribution hereof, health consciousness, | + | The social factors include norms and cultural aspects, the value of customers, demographics. The social factor includes factors like the growth rate of the population, income and the distribution hereof, health consciousness, etc |
| − | etc. | + | . |
The technological factor includes the department of research and development (R&D), the degree of innovation, technological awareness. | The technological factor includes the department of research and development (R&D), the degree of innovation, technological awareness. | ||
| Line 104: | Line 105: | ||
<ref name= "PESTEL Analysis ">https://www.professionalacademy.com/blogs-and-advice/marketing-theories---pestel-analysis visited 03-03-2020</ref> | <ref name= "PESTEL Analysis ">https://www.professionalacademy.com/blogs-and-advice/marketing-theories---pestel-analysis visited 03-03-2020</ref> | ||
| − | |||
== The Stage Gate Model == | == The Stage Gate Model == | ||
| − | [[File:Stage_gate_process.PNG|right|thumb|250px|Figure | + | [[File:Stage_gate_process.PNG|right|thumb|250px|Figure 4: shows the five stages of the stage gate process <ref name= "Stage gate process picture" >https://www.smartsheet.com/phase-gate-process visited 04-03-2020</ref>]] |
| − | The stage-gate process is a model that can be applied by companies and project managers to make sure that the project is processing in the right order. The original stage-gate process model was first described by Robert Cooper in 1993. In his description of the model, he had 5 stages. See figure | + | The stage-gate process is a model that can be applied by companies and project managers to make sure that the project is processing in the right order. The original stage-gate process model was first described by Robert Cooper in 1993. In his description of the model, he had 5 stages. See figure 4 to the right: |
# Preliminary investigation (Scoping) | # Preliminary investigation (Scoping) | ||
| Line 127: | Line 127: | ||
== Risk Assessment== | == Risk Assessment== | ||
| − | [[File:Risk_Matrix.PNG|right|thumb|300px|Figure | + | [[File:Risk_Matrix.PNG|right|thumb|300px|Figure 5: Shows the Risk Matrix based on the likelyhood and impact of the risk <ref name= "SRisk Matrix" >https://www.thereliabilityblog.com/tag/value-based-decisions/ visited 06-03-2020</ref>]] |
| − | There are many ways of evaluating risk within a project. One of the tools to do so is “The Risk Matrix”. The risk matrix is a tool that allows you to evaluate the risk factor on a likelihood scale and an impact scale. Within the likelihood scale, you evaluate the risk factor from a scale of “very likely, likely, possible, unlikely and very unlikely”. On the impact scale, you evaluate the risk on the scale “ negligible, minor, moderate, significant and severe”. The risk matrix then evaluates how severe the risk is by | + | There are many ways of evaluating risk within a project. One of the tools to do so is “The Risk Matrix”. The risk matrix is a tool that allows you to evaluate the risk factor on a likelihood scale and an impact scale. Within the likelihood scale, you evaluate the risk factor from a scale of “very likely, likely, possible, unlikely and very unlikely”. On the impact scale, you evaluate the risk on the scale “ negligible, minor, moderate, significant and severe”. The risk matrix then evaluates how severe the risk is by colour-coding is based on the likelihood of the risk as well as the impact of the risk. The Risk matrix can be found in figure 5 to the right. |
The following steps can be applied to create a risk assessment <ref name= "Risk Matrix1" >https://www.thereliabilityblog.com/tag/value-based-decisions/ | The following steps can be applied to create a risk assessment <ref name= "Risk Matrix1" >https://www.thereliabilityblog.com/tag/value-based-decisions/ | ||
visited 04-03-2020</ref> | visited 04-03-2020</ref> | ||
| Line 147: | Line 147: | ||
=== Crisis Management Strategy === | === Crisis Management Strategy === | ||
| − | [[File:Strategy.jpg|right|thumb|300px|Figure | + | [[File:Strategy.jpg|right|thumb|300px|Figure 6: The elements of the crisis management plan. <ref name= "Crisis Management">http://wiki.doing-projects.org/index.php/Crisis_management visited 06-03-2020</ref>]] |
| − | According to this tool, the crisis management approach is divided into five different steps, which is depicted in figure | + | According to this tool, the crisis management approach is divided into five different steps, which is depicted in figure 6. First, the crisis needs to be identified, isolated and the correct people need to be recruited. Next, a crisis management team (CMT) is deployed which consists of project-, crisis-, communication-, and stakeholder experts. The CMT is to develop a crisis management plan (CMP) and a crisis communication strategy (CCM), which describes what to do (“New project plan” with costs, predictions, schedules, milestones, etc) and how to communicate to the public, respectively. |
The whole purpose of crisis management is of cause to restore the project and bring it back on track. | The whole purpose of crisis management is of cause to restore the project and bring it back on track. | ||
| Line 171: | Line 171: | ||
== Earned Value Analysis (EVA) == | == Earned Value Analysis (EVA) == | ||
| − | In order to better control a project and its outcome, an Earned Value Analysis provides a quantitative method of estimating performance in accordance to time, cost and work progress. Generally it compares the planned progress to the amount of work actually completed at any given time during the project. Estimations are based on basic calculations, which indicate terms such as | + | In order to better control a project and its outcome, an Earned Value Analysis provides a quantitative method of estimating performance in accordance to time, cost and work progress. Generally, it compares the planned progress to the amount of work actually completed at any given time during the project. Estimations are based on basic calculations, which indicate terms such as |
* Planned Value (PV) | * Planned Value (PV) | ||
| Line 181: | Line 181: | ||
* Cost Variance (CV) and more. | * Cost Variance (CV) and more. | ||
| − | The terms in these calculations must be characterised before the analysis can take place. The key benefits of an Earned Value Analysis | + | The terms in these calculations must be characterised before the analysis can take place. The key benefits of an Earned Value Analysis are that it offers a framework for monitoring and optimising the processes within a project, program or portfolio, so to be able to know if the project will be finished in time and what the cost overrun, if any, is. |
<ref name= "Earned Value Analysis">http://wiki.doing-projects.org/index.php/Earned_Value_Analysis visited 06-03-2020</ref> | <ref name= "Earned Value Analysis">http://wiki.doing-projects.org/index.php/Earned_Value_Analysis visited 06-03-2020</ref> | ||
| + | |||
| + | == Integrated Cost and Schedule Control == | ||
| + | |||
| + | Planning is an essential part of succeeding projects. Since the future is unpredictable, controlling the progress of different tasks is important. When measuring the performance of a project, the actual accomplishment can be compared to the project plan and in that way get an indication of the alignment/misalignment. Schedule control can be divided into six steps; schedule development, communication, evaluation, comparison, problem identification, and procedure development. | ||
| + | |||
| + | Cost control is monitoring the status of the project costs. It helps managing changes and understands how the project is processing. Cost control can be divided into five steps; budget distribution, monitoring, comparison, calculation of variance, and implementation. <ref name= "Integrated COst and Schedule Control">http://wiki.doing-projects.org/index.php/Integrated_Cost_and_Schedule_Control visited 08-03-2020</ref> | ||
| + | |||
| + | == Reference Class Forecasting == | ||
| + | Reference Class Forecasting is a forecasting method for future events aiming to be unbiased. This requires the user to take an outside view. Reference Class Forecasting can be divided into three categories; identification of relevant reference classes, creation of a probability distribution, and benchmarking the project to the reference class. From this, the most probable outcome can be estimated.<ref name= "Reference Class Forecasting">http://wiki.doing-projects.org/index.php/Reference_Class_Forecasting_(RCF) visited 08-03-2020</ref> | ||
= '''Bibliography''' = | = '''Bibliography''' = | ||
<references/> | <references/> | ||
Latest revision as of 17:28, 8 March 2020
| Information on the new Storstroem Bridge |
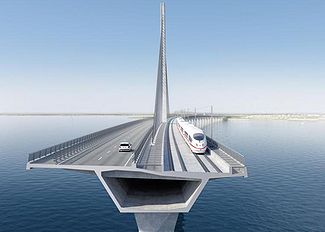 Design of the new Storstroem Bridge [1] |
| Construction price: appx. 4.1 billion DKK |
| Construction started: 2018 |
| Construction finished: 2022/2023 |
| Lenght of the Bridge: appx. 4 km |
| Clearance below: avg. 26 meters |
| Max speed cars: 80 km/h |
| Max speed trains: 200 km/h |
| Carrys: 2 train tracks, 2 road lanes, bicycle path & sidewalk |
| Main stakeholder: Ministry of Transportation and Housing, |
| BaneDanmark, and The Danish Road Directorate |
Created by: Johan Kjærsgaard Knudsen s164316, Kristoffer Sundberg Ipsen s164293, Sebastian Skaarup Lind s164299, Jonathan Friis Schouenborg s162692, Narwan Kabir Noori s164019, and Casper Solvang Andersen s164279
The Danish Road Directorate is currently the builder of the new Storstroem Bridge, also known as Storstrømsbroen. The construction of a new bridge and demolition of the old bridge is due to the construction of the tunnel across Feharnbelt which will result in an increased amount of mainly cargo trains using the railroad from Ringsted to Germany. The construction of the new Storstroem Bridge is only a part of the renovation of the aforementioned railroads done by BaneDanmark. The choice of building a new bridge instead of renovation the old bridge is due to lower socio-economic expenses that would otherwise have resulted in a shutdown of traffic on the bridge in serval years.
[edit] Collection of Tools
[edit] Critical Chain Project Management (CCPM)
Critical Chain Project Management (CCPM) is a method of planning, execution and managing projects. CCPM depends on three core principles: relative global urgency, clear stable priorities, and relay race culture. Using these core principles, also found in the critical chain approach, and focusing on the resources and not the different tasks CCPM should be able to speed up projects by 30% and increase the predictability up to around 90%. To conclude the main principle with CCPM is to remove the risk of delays, speed up projects and improve the predictability and instead have a time buffer that can be used. [2]
[edit] Change Orders (CO)
Change orders (CO) [3] is a general change from the original plan, e.g. in the project plan and the planned design, which are a common issue within the construction industry and usually result in delays and increased expenditures in the execution of the project. It is normal to see a 10-15% increase in the budget when COs not are included in the original budget. Thus, it is desirable to reduce the total amount of COs within a project. CO will always be cheaper when ordering it early in the project compared to late in the project due to neglection of redoing things.
[edit] Common Parameters Causing CO
- Bad Soil
- Material change
- Collision of structures
- Wrongly estimation of budget
- Quality does not live up to the expectations stated in the contract
- Bad communication and confusion
[edit] Reduce the Amount of CO
Building Information Modelling (BIM) can be a thing to reduce the amount of CO since it uses 3D drawing models (for instance with Solibri), that can compare structural models with the architect’s model. This will remove the uncertainty regarding the collision of structures within the project. Subsequently, this also gives a better cost estimation due to all component’s inclusion in the original plan. As a matter of integrating virtual reality, the property developer can visualize the building beforehand. Hence, the quality that does not live up to the expectation will be reduced. Another to reduce the amount of CO is to include the end-users through questionnaires or focus groups.
[edit] Ways to Manage CO
Two types of CO exist namely, a required and an elective. The required is a compulsory change that has to be made due to law requirements and that safety standards are not meet. The elective one is mandatory and is only due to the improvement of the existing project. When one of the above COs is to be executed, this should be included in the contracts with respect to the cost, which can be done in three ways. First, the unit price, which was already agreed upon in the beginning, second the lump sum, which is a detailed described of the new work scop and thereby a fixed cost and last the time & materials, which reflect the cost associated with the actual cost and material overrun for each day. The last solution is usually used, when the lump sum is hard to define. Subsequently, one of the following forms can be used between contractor and owner:
Deviation form: when extra work is added to the original scope from the contractor, which can be rejected or accepted by the owner.
Initiator change order request: Forecasted extra work to do the change.
Change order technical justification: Document of reliability which states the extra work needed.
[edit] Changes Within the Project
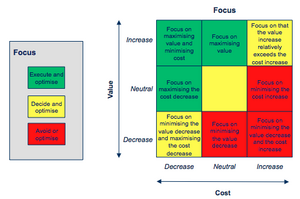
Changes within a project happen often and the project manager needs to learn how to deal with these changes. The change matrix in figure 1 to the right is a tool that provides a helpful overview of different changes within the project and how to deal with these changes.
On the y-axis is the value of the project and on the x-axis is the change of cost. The optimal location for a project is in the upper left corner (green). This is because you increase the value of the project with the lowest possible cost/cost increase of the project. As a project manager, you should try to execute and optimize this field as much as you can.
On the other hand, it is the lower right corner of the matrix. Here the change initiative will decrease the value of the project and increase the cost of the project. As a project manager, you should try to avoid or try to optimize the change in a way that will provide a better outcome of the project. The yellow areas of the matrix are areas that you as a project manager should watch and optimize. Here you should simply figure out how to reduce the cost and still maintain your high value of the project or make sure that the cost does not increase but that the value of the project will increase.
[edit] Triple Constraint Theory
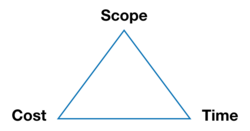
It is inevitable to avoid constraints when doing projects. These constraints can be categorized into three categories which are scope, cost and time. These categories form the base of the iron triangle which is also called the triple constraint theory. An illustration of the iron triangle can be found in figure 2 to the right.
According to ISO standard 12500 states that a change in one of the constraints will affect the others. Therefore, the principle of the iron triangle is that you can prioritize or focus on two out three constraint categories in the iron triangle leaving the third to be determined based on your choices with the two constraints.
One of the limitations of applying the iron triangle is that there is a chance that you are underestimating the complexity of the project by simplifying it to a simple overview. This is a limitation since it could shift the focus from the origin of the project.
[edit] Management Reserves Vs. Contingency Reserves
When you are creating a project budget you often take three aspects into account: Cost estimate, Contingency reserve, and Management reserve. The cost estimate is as the word indicates an estimation of the cost of the project. The contingency reserve is a reserve that is used to be prepared for known unknown factors this could i.e. be significant changes in the scope of the project, unforeseen extreme weather conditions. The cost estimation and the contingency reserve represent the cost baseline of the project. In addition, the management reserve. It is only the project manager that is able to control this reserve. Management reserves are to control unknown unknowns and are determined by the organization. The three of these combined makes the project budget.
[edit] Cost Estimation Techniques for Projects
Before a project manager even starts a project is it vital to know an estimation on the total price of the project which always will be questioned by the stakeholders. In order to make a fast and accurate estimation of the total cost, a set of techniques and methods can be used by the project manager. These methods and techniques differ from each other in both time and resource consumption but may vary in accuracy. For project managers, all possible parameters have to be considered and the usage of all appropriate techniques for each specific project or a combination of techniques. [5]
[edit] PESTEL Analysis
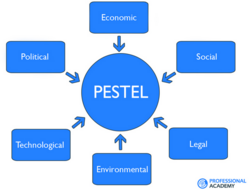
A PESTEL analysis is an extended version of the PEST analysis and it contains political, economic, social, technological, environmental and legal aspects. The manager can apply this to analyze and monitor macro-environmental factors that may have an impact on the organization. A PESTEL analysis is often applied in combination with a SWOT analysis where you are looking at strengths, weaknesses, opportunities, and threats to a company or a special case of the company. An illustration of the PESTEL analysis can be found in figure 3 to the right.
The political factor is the degree to which the government intervenes with a specific industry. The initiatives could, for instance, be; tax increment/decrease, laws, and regulation (including laws to protect the environment).
The economic factors include economic growth, interest rates, inflation, unemployment rates, etc. The economic factor influences the purchasing power of a company.
The social factors include norms and cultural aspects, the value of customers, demographics. The social factor includes factors like the growth rate of the population, income and the distribution hereof, health consciousness, etc .
The technological factor includes the department of research and development (R&D), the degree of innovation, technological awareness.
The environmental factor include ecological environmental aspects. This includes Corporate Sustainability Responsibility (CSR), climate, recycling, and etc. [7]
The legal factor includes that the organization must operate on legal terms. In addition, the organisation must be aware of a change in legislation, and etc.
[edit] The Stage Gate Model
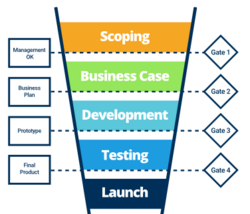
The stage-gate process is a model that can be applied by companies and project managers to make sure that the project is processing in the right order. The original stage-gate process model was first described by Robert Cooper in 1993. In his description of the model, he had 5 stages. See figure 4 to the right:
- Preliminary investigation (Scoping)
- Constructing the business case
- Develop the product
- Validate and test the product
- Launch the product
In the first stage, you do the scoping of the project and examine whether this has the potential to become a project. In the second stage, you create the business case meaning that you define the project in greater detail – meaning that you create a project definition and a project plan to make it easier to make sure that the project is on track. The third stage is where you develop the product of the project. After this stage, you continue to stage 4 where you validate the product by testing the product durability, quality, and etc. In the fifth stage, you launch the product to a given market(s). [9]
[edit] Project Control
A project from start to finish can be divided into five categories; Conception & Initiation, Definition & Planning, Launch or Execution, Monitor & Control, and Project Close. The tool Project Control relates to the fourth one, Monitor and Control. Control of a project has a significant meaning throughout the lifecycle of a project, which is a reason why the tool has its relevance. Within Project Control it is important to look into cost and time, and how to control and manage these. Some indicators are performance, time, and cost, where you look at the resources used, the time spend, and the cost of the activities. Ressources usually cover money, manpower, materials, and machinery. Apart from controlling time and cost, Project Control is also useful to control risk, quality, and scope.
[edit] Risk Assessment
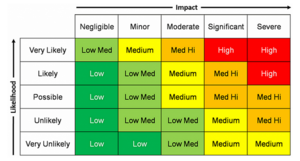
There are many ways of evaluating risk within a project. One of the tools to do so is “The Risk Matrix”. The risk matrix is a tool that allows you to evaluate the risk factor on a likelihood scale and an impact scale. Within the likelihood scale, you evaluate the risk factor from a scale of “very likely, likely, possible, unlikely and very unlikely”. On the impact scale, you evaluate the risk on the scale “ negligible, minor, moderate, significant and severe”. The risk matrix then evaluates how severe the risk is by colour-coding is based on the likelihood of the risk as well as the impact of the risk. The Risk matrix can be found in figure 5 to the right. The following steps can be applied to create a risk assessment [11]
- Identification of risks (Find the relevant risks to your project)
- Evaluation of risks (applying the risk matrix)
- Create a strategy on how to deal with risks (Contingency plan/strategy)
[edit] Crisis Management
For this tool, a crisis is divided into three pieces, namely:
- Pre-crisis Stage: This stage is characterized by signs indicating that a crisis most likely is to appear soon. At this stage, the information is still located inside the project and organization.
- Acute-crisis Stage: When the information is leaked outside the project and organization, the situation is deemed as a crisis. In this stage, a specific strategy is to be executed, which is described below.
- Post-crisis Stage: This stage is characterized by restoring the faith to the organization in charge.
[edit] Crisis Management Strategy

According to this tool, the crisis management approach is divided into five different steps, which is depicted in figure 6. First, the crisis needs to be identified, isolated and the correct people need to be recruited. Next, a crisis management team (CMT) is deployed which consists of project-, crisis-, communication-, and stakeholder experts. The CMT is to develop a crisis management plan (CMP) and a crisis communication strategy (CCM), which describes what to do (“New project plan” with costs, predictions, schedules, milestones, etc) and how to communicate to the public, respectively. The whole purpose of crisis management is of cause to restore the project and bring it back on track.
Already before the crisis occurs (long before the pre-crisis Stage), the project management team should have proactively developed a plan on how to act and hence include it as a part of their risk management. [12]
[edit] Management of Resources
One of the most critical and important things to manage as a project manager is the resources available for the project. Proper and beneficial resource management will often result in a lower total project cost and finalization of the project to the critical part. This can be due to effective utilization of HR which ensures that no workload is either too high or too low but distributed equally [13]. To ensure the proper amount of available resources when needed the following needs to be managed:
- Plan Resource Management
- Estimating Activity Resources
- Acquire Resources
- Develop Team
- Manage Team
- Control Resources
[edit] Earned Value Analysis (EVA)
In order to better control a project and its outcome, an Earned Value Analysis provides a quantitative method of estimating performance in accordance to time, cost and work progress. Generally, it compares the planned progress to the amount of work actually completed at any given time during the project. Estimations are based on basic calculations, which indicate terms such as
- Planned Value (PV)
- Actual Cost (AC)
- Earned Value (EV)
- Cost Variance (CV) and more.
The terms in these calculations must be characterised before the analysis can take place. The key benefits of an Earned Value Analysis are that it offers a framework for monitoring and optimising the processes within a project, program or portfolio, so to be able to know if the project will be finished in time and what the cost overrun, if any, is. [14]
[edit] Integrated Cost and Schedule Control
Planning is an essential part of succeeding projects. Since the future is unpredictable, controlling the progress of different tasks is important. When measuring the performance of a project, the actual accomplishment can be compared to the project plan and in that way get an indication of the alignment/misalignment. Schedule control can be divided into six steps; schedule development, communication, evaluation, comparison, problem identification, and procedure development.
Cost control is monitoring the status of the project costs. It helps managing changes and understands how the project is processing. Cost control can be divided into five steps; budget distribution, monitoring, comparison, calculation of variance, and implementation. [15]
[edit] Reference Class Forecasting
Reference Class Forecasting is a forecasting method for future events aiming to be unbiased. This requires the user to take an outside view. Reference Class Forecasting can be divided into three categories; identification of relevant reference classes, creation of a probability distribution, and benchmarking the project to the reference class. From this, the most probable outcome can be estimated.[16]
[edit] Bibliography
- ↑ https://femern.info/sites/default/files/styles/storst_750_x_750_/public/2019-08/20170913_snit_perspektiv.jpg?itok=YnOibwQN visited 06-03-2020
- ↑ http://wiki.doing-projects.org/index.php/Critical_chain_project_management_(CCPM) visited 03-03-2020
- ↑ http://wiki.doing-projects.org/index.php/Change_order visited 03-03-2020
- ↑ 4.0 4.1 http://wiki.doing-projects.org/index.php/Management_of_Project_Change visited 03-03-2020
- ↑ http://wiki.doing-projects.org/index.php/Cost_Estimation_Techniques_for_Projects visited 03-03-2020
- ↑ 6.0 6.1 https://www.professionalacademy.com/blogs-and-advice/marketing-theories---pestel-analysis visited 03-03-2020
- ↑ https://blog.oxfordcollegeofmarketing.com/2016/06/30/pestel-analysis/ visited 03-03-2020
- ↑ https://www.smartsheet.com/phase-gate-process visited 04-03-2020
- ↑ http://wiki.doing-projects.org/index.php/Fuzzy_Front_End_Management visited 04-03-2020
- ↑ https://www.thereliabilityblog.com/tag/value-based-decisions/ visited 06-03-2020
- ↑ https://www.thereliabilityblog.com/tag/value-based-decisions/ visited 04-03-2020
- ↑ 12.0 12.1 http://wiki.doing-projects.org/index.php/Crisis_management visited 06-03-2020
- ↑ http://wiki.doing-projects.org/index.php/Resources_in_Project_Management 06-03-2020
- ↑ http://wiki.doing-projects.org/index.php/Earned_Value_Analysis visited 06-03-2020
- ↑ http://wiki.doing-projects.org/index.php/Integrated_Cost_and_Schedule_Control visited 08-03-2020
- ↑ http://wiki.doing-projects.org/index.php/Reference_Class_Forecasting_(RCF) visited 08-03-2020