COWI2020
(→Stakeholder Management) |
(→Target Value Design) |
||
| (101 intermediate revisions by 6 users not shown) | |||
| Line 1: | Line 1: | ||
| + | The tools in this article are chosen to support the group's project on implementation of Target Value Design in consultant company COWI. | ||
| + | |||
| + | |||
| + | == Target Value Design == | ||
| + | Target Value Design (TVD) is a method for designing projects with a strong emphasis on development of project scope, with given time and cost constraints. | ||
| + | |||
| + | |||
| + | Target Value Design takes many of the classic principles, and turn them upside-down | ||
| + | |||
| + | :-Instead of estimations of cost and schedule being based on a detailed design, TVD are based on detailed cost and schedule estimates. | ||
| + | |||
| + | :-Instead of evaluating whether or not a design is constructible, a design is made based on what is constructible. | ||
| + | |||
| + | :-Instead of individuals designing by themselves, taking it into group meetings for review and decisions, designers work together in teams to define what issues needs solving, and then design solutions to solve those issues. | ||
| + | |||
| + | :-Instead of narrowing down on choices to move on in the design process, several sets of solutions are kept far into the process to keep options open. | ||
| + | |||
| + | :-Instead of individuals working in separate rooms, teams work in larger group rooms. | ||
| + | |||
| + | In addition to implementing these principles, TVD also uses certain practices to make sure that the design process gives the targeted project value. Clients are deeply engaged throughout the whole process to make sure that target value are met. Client and designer have a shared responsibility for revealing concerns and and refining the design to avoid said concerns from happening. <ref name="TVD"> Macomber, H & Barberio, J (2007) Target-Value Design: | ||
| + | Nine Foundational Practices for Delivering Surprising Client Value. [online] https://www.leanconstruction.org/media/docs/3-Target-Value-Design-LPC.pdf [Accessed 1 Mar. 2020]. </ref> | ||
| + | |||
| + | |||
| + | Implementing TVD in projects have in many cases, although spending more resources in the design phase, shown to reduce the total project cost. In addition to this, client satisfaction are usually much higher. This often is due to the fact that clients are engaged and involved from a very early stage, giving a strong sense of ownership to the project. <ref name="NTNU"> Malm, E & Rybakiewicz, L (2018) Implementering av Target Value Delivery | ||
| + | i norsk byggebransje [online] https://ntnuopen.ntnu.no/ntnu-xmlui/bitstream/handle/11250/2560137/19936_FULLTEXT.pdf?sequence=1&isAllowed=y [Accessed 1 Mar. 2020]. </ref> | ||
| + | |||
| + | = '''Collection of project management tools''' = | ||
| + | |||
| + | == SWOT Analysis == | ||
| + | [[File:SWOT.png|200px|thumb|right|Figure 1: Conventional SWOT analysis.]] | ||
| + | |||
| + | The SWOT analysis is a tool that provides a basic framework for situation analysis. It generates lists or inventories of strengths, weaknesses, opportunities and threats which can be used when generating strategies. | ||
| + | |||
| + | In project and program management the SWOT analysis can be carried out in all phases of the life cycle in order to monitor and manage internal and external environments. In portfolio management the SWOT analysis can be used to identify new projects, although, there is no single guide or manual on how to perform a SWOT analysis. The conventional SWOT analysis is usually presented in a 2X2 matrix which generates four boxes of inventories - one for strengths, one for weaknesses, one for opportunities and one for threats. See figure 1. | ||
| + | |||
| + | |||
| + | |||
| + | |||
| + | |||
| + | |||
| + | |||
== Stakeholder Management == | == Stakeholder Management == | ||
| − | + | [[File:int-inf.jpg|250px|thumb|right|Figure 2: Power/intrest map illustration.]] | |
| + | |||
| + | Stakeholders are organisations and persons who are actively involved in a project or affected by a project at some stage during its execution or completion. The ISO 21500 standard defines a stakeholder as "a person, group or organisation that has interests in, or can affect, be affected by, or perceive itself to be affected by, any aspect of the project". The purpose of identifying and classifying stakeholders is to simplify the process of identifying stakeholder concerns and thereby obtaining an easier tool for solving issues. | ||
| + | |||
| + | The growing focus on stakeholder analysis is a clear reflection of the general tendency to recognise how stakeholders can influence decision-making processes.Based on the analysis of the stakeholders these can be mapped into overall categories, which allows the managers in an organisation to take action. The most commonly used stakeholder map is the power/interest matrix, seen in the figure to the right, which gives an easy and simple overview of what the different categories require with regards to what their needs are and how much they are able to influence the project. | ||
| + | |||
| + | |||
== Benefits Map == | == Benefits Map == | ||
| + | |||
| + | [[File:Benefits Map.png|200px|thumb|right|Figure 3: Example of a Benefits Map Layout (click Figure for full size)]] | ||
| + | |||
| + | Benefits Map helps mapping possible benefits related to different projects and/or programs. This is to make it easier to pick the solutions giving the most or best benefits for the relevant stakeholders. Examples on benefits could be economical aspects or user friendliness. It is important to include key stakeholders and get their input in the benefit mapping process. | ||
| + | |||
| + | The Benefit Mapping Process is usually divided into three important stages; identification of benefits, execution of benefits and the sustain of benefits. This means that the process is not only something that needs to be implemented from the start, but carried out throughout the project and even after project implementation. | ||
| + | |||
| + | |||
| + | |||
| + | |||
| + | |||
| + | |||
| + | |||
| + | |||
| + | == Earned Value Analysis == | ||
| + | |||
| + | An Earned Value Analysis (EVA) used quantative analysis techniques and object performance indicators to measure both work progress and related cost to determine the overall efficiency of a respective activity, work package or project. To be able to do this, the analysis takes into account the scope of the project, the schedule of work and the work undertaken. This is to map the current situation, how much resources that has already been used and how much recourses that is necessary to finalize the project. | ||
| + | |||
| + | To successfully execute an EVA the following steps needs to be done: | ||
| + | |||
| + | '''1) Time-based schedule''' | ||
| + | |||
| + | '''2) Work Breakdown Structure''' | ||
| + | |||
| + | '''3) Cost Assessment''' | ||
| + | |||
| + | '''4) Progress measurement''' | ||
| + | |||
| + | '''5) Responsibility/ authority matrix''' | ||
| + | |||
| + | '''6) Monitoring and review process''' | ||
| + | |||
| + | |||
| + | == Value Stream Mapping == | ||
| + | |||
| + | [[File:VMS.png|200px|thumb|right|Figure 4: Value stream mapping (click Figure for full size)]] | ||
| + | |||
| + | Value Stream Mapping is a tool from Lean Construction that has a significant impact in revealing the waste of production. | ||
| + | The basic idea behind Value stream mapping is to provide a visual overview of the value stream in the production or organization that can help the organization improve the value stream by eliminating waste. The value stream analysis provides a clear view of the production from raw materials to finished product. The survey provides a better understanding of how the flow of materials and information flow through the value stream. | ||
| + | |||
| + | VSM tool has shown to improve communication between the subjects through involvement and collaboration, enabling a structured method to work on continuous improvement and to solve communication problems in projects. | ||
| + | |||
| + | |||
| + | |||
| + | |||
| + | == Benefits Realisation Management == | ||
| + | Benefits Realisation Management (BRM) is a way to organise and manage how time and resources to realise the highest achievable benefits in a project. By implementing a set of processes and principles BRM is used to make sure that execution and the planned strategy comes as close to each other as possible. | ||
| + | |||
| + | |||
| + | |||
| + | '''Identification''' | ||
| + | |||
| + | First, the benefits that the project gives should be identified to determine if it can give the wanted benefits, and if giving them within reasonable investment frames. | ||
| + | |||
| + | '''Execute''' | ||
| + | |||
| + | The next step is to execute chosen processes and principles to maximise the opportunity of achieving and minimising the risks of not achieving the identified benefits. | ||
| + | |||
| + | '''Sustain''' | ||
| + | |||
| + | After project completion, the project output should be managed in a way so that it continues to produce maximum value. | ||
| + | |||
| + | == Project Management: Cost vs. Price == | ||
| + | |||
| + | [[File:PCMwiki.png|200px|thumb|right|Figure 5: Project Cost Management (click Figure for full size)]] | ||
| + | |||
| + | Regardless of the size of a project, the associated costs should be highly managed to maintain the optimal price in which we want to sell it. The relationship between cost and price, and the two separately, proves high importance related to project management. <ref name="PMBOK guide"> ''lProject Management: A guide to the Project Management Body of Knowledge (PMBOKguide)''</ref> | ||
| + | |||
| + | Cost, price, profit and quality are highly important in decision making for pricing a project or select which costs are avoidable and which ones are necessary. These factors determine the project’s quality and profit, and are directly connected to the relationship between cost and price (for every project), and the costumers may evaluate the value of a project from its price and the costs necessary to obtain the optimal quality outcome. | ||
| + | |||
| + | An overall costs structure of the project is necessary to plan to complete a projects within the approved budget limit (frame). Therefore, the project should start by; estimating the costs, creating a budget, developing a plan of funding financing and managing, and develop a plan of costs control (see figure). | ||
| + | |||
| + | The efficiency of Project Cost Management is improved significantly if the project’s scope is well defined from the beginning. If the project is not well defined, the level of uncertainties connected to the project increase, thus the tools for Project Cost Management is harder to define and changes may apply to the estimates. | ||
| + | |||
| + | |||
| + | == Integrated Cost and Schedule Control == | ||
| + | |||
| + | |||
| + | In order to obtain appropriate planning, it is important to measure and monitor the project performance. Schedule Control is when the planned schedule is compared to the accomplished one. At the same time, Cost Control is the balance between budgeted cost and the actual cost. These two tools (Schedule- and Cost Control) are useful to monitor that the project is performing in an optimal manner. <ref name="PMI"> PMI. (2013). "A Guide to the Project Management Body of Knowledge (PMBOK® Guide)", Fifth Edition </ref> | ||
| + | |||
| + | Schedule Control is understood as the process of monitoring the status of project activities to update project progress and manage changes to the schedule baseline to achieve the plan. The process is done by using a set of different tools, such as Critical Path Method, Critical Chain project Management, various modelling techniques, Variance Analysis just to name a few. | ||
| + | |||
| + | Cost Control is known as the process of monitoring the status of the project to update costs and managing changes to the cost baseline. This process is applicable in all projects (regardless of size) due to its importance in reducing risks and overcosts, especially in those which have a fixed price – such as for a TVD project. | ||
| + | |||
| + | == Triple Constraint == | ||
| + | |||
| + | [[File:IRON_TM.png|200px|thumb|right|Figure 6: The triple constraint triangle (click Figure for full size)]] | ||
| + | |||
| + | The triple constraint, also called the iron triangle, is a basic tool in project management to measure the progress of project/s <ref name="PM1"> Zaeem Ahmad Siddiqui (2015). Triple Constraint theory / Project Management Triangle (PMT). [online] https://www.linkedin.com/pulse/triple-constraint-theory-project-management-triangle-pmt-siddiqui/ [Accessed 6 Mar. 2020]. </ref>. There are multiple constraints associated with doing projects, but it is possible to divide the constraints into three main interdependent constraint; time, cost and scope. Time is the schedule for the project to reach completion, cost is the financial constraints of a project (also known as the project budget), and scope is the tasks required to fulfill the project`s goals <ref name="PM2"> Jason Westland (2018). The Triple Constraint in Project Management: Time, Scope & Cost. [online] https://www.projectmanager.com/blog/triple-constraint-project-management-time-scope-cost [Accessed 6 Mar. 2020]. </ref>. Figure 6 illustrate the triple constraint triangle. | ||
| + | |||
| + | The idea is that the Project Manager should aim to maintain a balance between these three factors to make the project successful <ref name="PM3"> Swaroop Kumar Sahu (2018). Project Management Triangle. [online] http://apppm.man.dtu.dk/index.php/Project_Management_Triangle [Accessed 6 Mar. 2020]. </ref>. The project manager needs to understand how the three constraints interrelate with each other and what each constraint is implying in order to be able to use the constraints as objectives. The three constraints are highly interdependent to each other. Neither of the three can be changed without affecting one or both of the other two factors in a positive or negative way. For example, the change of scope in the project will properly cost more and/or take longer time or change in cost will affect the other two factors. | ||
| + | |||
| + | A general rule is that the project manager can only focus on two out of the three constraints, and the third will be determined based on the choices with the two constraints. | ||
| + | |||
| + | == The A3 report == | ||
| + | |||
| + | [[File:A3_report.png|200px|thumb|right|Figure 7: The problem-solving A3 report (click Figure for full size)]] | ||
| + | |||
| + | The idea behind the tool was developed by Toyota and has been used since the 1960’s for standard problem solving, proposals, plans and status reviews <ref name="PM7"> Lise Sjørup Elle (2018). The A3 report. [online] http://wiki.doing-projects.org/index.php/The_A3_report [Accessed 8 Mar. 2020]. </ref>. It is typically used by lean manufacturing practitioners in business for the control and continuous improvement of processes and products.. The tool is named A3 report since it fits on one side of an A3 size paper (11 inches x 17 inches). | ||
| + | |||
| + | The A3 report has been developed into several different types. It can utilize various forms depending upon the organizations needs and preferences. One thing that all of the types have in common is that they follow the Plan, Do, Check, Act (PDCA) method <ref name="PM71"> Quality-One. A3 Problem Solving. [online] https://quality-one.com/a3/ [Accessed 8 Mar. 2020]. </ref>, and the report documents the findings from the PDCA cycle. It is like a circle that has no end, the PDCA cycle should be repeated again and again for continuous improvement. | ||
| + | |||
| + | The problem-solving A3 report is the most common. Figure 7 shows a simplified template of it, where the blue indicate the plan-phase, brown indicate the do-phase, yellow indicate the check-phase and pink indicate the act-phase. | ||
| + | |||
| + | |||
| + | == References == | ||
| + | |||
| + | *''' Project Management: A guide to the Project Management Body of Knowledge (PMBOKguide) - 6th edition ''' | ||
| + | '''Chapter 7''' - This chapter, Project Cost Management, explains what is the importance to plan the costs in advance the beginning of the project, which are the components and their importance and how they are completed in order to successfully achieve the final result. | ||
| + | |||
| + | <references /> | ||
Latest revision as of 10:08, 9 March 2020
The tools in this article are chosen to support the group's project on implementation of Target Value Design in consultant company COWI.
Contents |
[edit] Target Value Design
Target Value Design (TVD) is a method for designing projects with a strong emphasis on development of project scope, with given time and cost constraints.
Target Value Design takes many of the classic principles, and turn them upside-down
- -Instead of estimations of cost and schedule being based on a detailed design, TVD are based on detailed cost and schedule estimates.
- -Instead of evaluating whether or not a design is constructible, a design is made based on what is constructible.
- -Instead of individuals designing by themselves, taking it into group meetings for review and decisions, designers work together in teams to define what issues needs solving, and then design solutions to solve those issues.
- -Instead of narrowing down on choices to move on in the design process, several sets of solutions are kept far into the process to keep options open.
- -Instead of individuals working in separate rooms, teams work in larger group rooms.
In addition to implementing these principles, TVD also uses certain practices to make sure that the design process gives the targeted project value. Clients are deeply engaged throughout the whole process to make sure that target value are met. Client and designer have a shared responsibility for revealing concerns and and refining the design to avoid said concerns from happening. [1]
Implementing TVD in projects have in many cases, although spending more resources in the design phase, shown to reduce the total project cost. In addition to this, client satisfaction are usually much higher. This often is due to the fact that clients are engaged and involved from a very early stage, giving a strong sense of ownership to the project. [2]
[edit] Collection of project management tools
[edit] SWOT Analysis
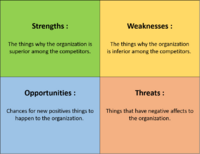
The SWOT analysis is a tool that provides a basic framework for situation analysis. It generates lists or inventories of strengths, weaknesses, opportunities and threats which can be used when generating strategies.
In project and program management the SWOT analysis can be carried out in all phases of the life cycle in order to monitor and manage internal and external environments. In portfolio management the SWOT analysis can be used to identify new projects, although, there is no single guide or manual on how to perform a SWOT analysis. The conventional SWOT analysis is usually presented in a 2X2 matrix which generates four boxes of inventories - one for strengths, one for weaknesses, one for opportunities and one for threats. See figure 1.
[edit] Stakeholder Management
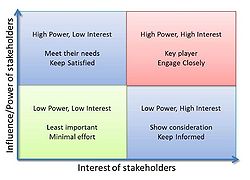
Stakeholders are organisations and persons who are actively involved in a project or affected by a project at some stage during its execution or completion. The ISO 21500 standard defines a stakeholder as "a person, group or organisation that has interests in, or can affect, be affected by, or perceive itself to be affected by, any aspect of the project". The purpose of identifying and classifying stakeholders is to simplify the process of identifying stakeholder concerns and thereby obtaining an easier tool for solving issues.
The growing focus on stakeholder analysis is a clear reflection of the general tendency to recognise how stakeholders can influence decision-making processes.Based on the analysis of the stakeholders these can be mapped into overall categories, which allows the managers in an organisation to take action. The most commonly used stakeholder map is the power/interest matrix, seen in the figure to the right, which gives an easy and simple overview of what the different categories require with regards to what their needs are and how much they are able to influence the project.
[edit] Benefits Map
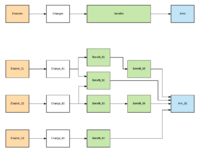
Benefits Map helps mapping possible benefits related to different projects and/or programs. This is to make it easier to pick the solutions giving the most or best benefits for the relevant stakeholders. Examples on benefits could be economical aspects or user friendliness. It is important to include key stakeholders and get their input in the benefit mapping process.
The Benefit Mapping Process is usually divided into three important stages; identification of benefits, execution of benefits and the sustain of benefits. This means that the process is not only something that needs to be implemented from the start, but carried out throughout the project and even after project implementation.
[edit] Earned Value Analysis
An Earned Value Analysis (EVA) used quantative analysis techniques and object performance indicators to measure both work progress and related cost to determine the overall efficiency of a respective activity, work package or project. To be able to do this, the analysis takes into account the scope of the project, the schedule of work and the work undertaken. This is to map the current situation, how much resources that has already been used and how much recourses that is necessary to finalize the project.
To successfully execute an EVA the following steps needs to be done:
1) Time-based schedule
2) Work Breakdown Structure
3) Cost Assessment
4) Progress measurement
5) Responsibility/ authority matrix
6) Monitoring and review process
[edit] Value Stream Mapping
Value Stream Mapping is a tool from Lean Construction that has a significant impact in revealing the waste of production. The basic idea behind Value stream mapping is to provide a visual overview of the value stream in the production or organization that can help the organization improve the value stream by eliminating waste. The value stream analysis provides a clear view of the production from raw materials to finished product. The survey provides a better understanding of how the flow of materials and information flow through the value stream.
VSM tool has shown to improve communication between the subjects through involvement and collaboration, enabling a structured method to work on continuous improvement and to solve communication problems in projects.
[edit] Benefits Realisation Management
Benefits Realisation Management (BRM) is a way to organise and manage how time and resources to realise the highest achievable benefits in a project. By implementing a set of processes and principles BRM is used to make sure that execution and the planned strategy comes as close to each other as possible.
Identification
First, the benefits that the project gives should be identified to determine if it can give the wanted benefits, and if giving them within reasonable investment frames.
Execute
The next step is to execute chosen processes and principles to maximise the opportunity of achieving and minimising the risks of not achieving the identified benefits.
Sustain
After project completion, the project output should be managed in a way so that it continues to produce maximum value.
[edit] Project Management: Cost vs. Price
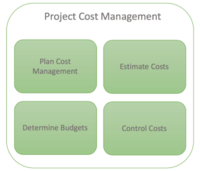
Regardless of the size of a project, the associated costs should be highly managed to maintain the optimal price in which we want to sell it. The relationship between cost and price, and the two separately, proves high importance related to project management. [3]
Cost, price, profit and quality are highly important in decision making for pricing a project or select which costs are avoidable and which ones are necessary. These factors determine the project’s quality and profit, and are directly connected to the relationship between cost and price (for every project), and the costumers may evaluate the value of a project from its price and the costs necessary to obtain the optimal quality outcome.
An overall costs structure of the project is necessary to plan to complete a projects within the approved budget limit (frame). Therefore, the project should start by; estimating the costs, creating a budget, developing a plan of funding financing and managing, and develop a plan of costs control (see figure).
The efficiency of Project Cost Management is improved significantly if the project’s scope is well defined from the beginning. If the project is not well defined, the level of uncertainties connected to the project increase, thus the tools for Project Cost Management is harder to define and changes may apply to the estimates.
[edit] Integrated Cost and Schedule Control
In order to obtain appropriate planning, it is important to measure and monitor the project performance. Schedule Control is when the planned schedule is compared to the accomplished one. At the same time, Cost Control is the balance between budgeted cost and the actual cost. These two tools (Schedule- and Cost Control) are useful to monitor that the project is performing in an optimal manner. [4]
Schedule Control is understood as the process of monitoring the status of project activities to update project progress and manage changes to the schedule baseline to achieve the plan. The process is done by using a set of different tools, such as Critical Path Method, Critical Chain project Management, various modelling techniques, Variance Analysis just to name a few.
Cost Control is known as the process of monitoring the status of the project to update costs and managing changes to the cost baseline. This process is applicable in all projects (regardless of size) due to its importance in reducing risks and overcosts, especially in those which have a fixed price – such as for a TVD project.
[edit] Triple Constraint
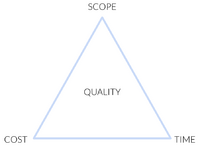
The triple constraint, also called the iron triangle, is a basic tool in project management to measure the progress of project/s [5]. There are multiple constraints associated with doing projects, but it is possible to divide the constraints into three main interdependent constraint; time, cost and scope. Time is the schedule for the project to reach completion, cost is the financial constraints of a project (also known as the project budget), and scope is the tasks required to fulfill the project`s goals [6]. Figure 6 illustrate the triple constraint triangle.
The idea is that the Project Manager should aim to maintain a balance between these three factors to make the project successful [7]. The project manager needs to understand how the three constraints interrelate with each other and what each constraint is implying in order to be able to use the constraints as objectives. The three constraints are highly interdependent to each other. Neither of the three can be changed without affecting one or both of the other two factors in a positive or negative way. For example, the change of scope in the project will properly cost more and/or take longer time or change in cost will affect the other two factors.
A general rule is that the project manager can only focus on two out of the three constraints, and the third will be determined based on the choices with the two constraints.
[edit] The A3 report
The idea behind the tool was developed by Toyota and has been used since the 1960’s for standard problem solving, proposals, plans and status reviews [8]. It is typically used by lean manufacturing practitioners in business for the control and continuous improvement of processes and products.. The tool is named A3 report since it fits on one side of an A3 size paper (11 inches x 17 inches).
The A3 report has been developed into several different types. It can utilize various forms depending upon the organizations needs and preferences. One thing that all of the types have in common is that they follow the Plan, Do, Check, Act (PDCA) method [9], and the report documents the findings from the PDCA cycle. It is like a circle that has no end, the PDCA cycle should be repeated again and again for continuous improvement.
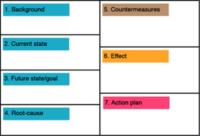
The problem-solving A3 report is the most common. Figure 7 shows a simplified template of it, where the blue indicate the plan-phase, brown indicate the do-phase, yellow indicate the check-phase and pink indicate the act-phase.
[edit] References
- Project Management: A guide to the Project Management Body of Knowledge (PMBOKguide) - 6th edition
Chapter 7 - This chapter, Project Cost Management, explains what is the importance to plan the costs in advance the beginning of the project, which are the components and their importance and how they are completed in order to successfully achieve the final result.
- ↑ Macomber, H & Barberio, J (2007) Target-Value Design: Nine Foundational Practices for Delivering Surprising Client Value. [online] https://www.leanconstruction.org/media/docs/3-Target-Value-Design-LPC.pdf [Accessed 1 Mar. 2020].
- ↑ Malm, E & Rybakiewicz, L (2018) Implementering av Target Value Delivery i norsk byggebransje [online] https://ntnuopen.ntnu.no/ntnu-xmlui/bitstream/handle/11250/2560137/19936_FULLTEXT.pdf?sequence=1&isAllowed=y [Accessed 1 Mar. 2020].
- ↑ lProject Management: A guide to the Project Management Body of Knowledge (PMBOKguide)
- ↑ PMI. (2013). "A Guide to the Project Management Body of Knowledge (PMBOK® Guide)", Fifth Edition
- ↑ Zaeem Ahmad Siddiqui (2015). Triple Constraint theory / Project Management Triangle (PMT). [online] https://www.linkedin.com/pulse/triple-constraint-theory-project-management-triangle-pmt-siddiqui/ [Accessed 6 Mar. 2020].
- ↑ Jason Westland (2018). The Triple Constraint in Project Management: Time, Scope & Cost. [online] https://www.projectmanager.com/blog/triple-constraint-project-management-time-scope-cost [Accessed 6 Mar. 2020].
- ↑ Swaroop Kumar Sahu (2018). Project Management Triangle. [online] http://apppm.man.dtu.dk/index.php/Project_Management_Triangle [Accessed 6 Mar. 2020].
- ↑ Lise Sjørup Elle (2018). The A3 report. [online] http://wiki.doing-projects.org/index.php/The_A3_report [Accessed 8 Mar. 2020].
- ↑ Quality-One. A3 Problem Solving. [online] https://quality-one.com/a3/ [Accessed 8 Mar. 2020].
