Fishbone Diagram
(→Limitations) |
|||
| (16 intermediate revisions by one user not shown) | |||
| Line 5: | Line 5: | ||
This article aims to provide an overview of how the diagram is best used as a risk management tool as well as discussing application and limitations. Hereby also mentioning different tools that can be used in combination with the Fishbone Diagram to strengthen the risk management of a project. | This article aims to provide an overview of how the diagram is best used as a risk management tool as well as discussing application and limitations. Hereby also mentioning different tools that can be used in combination with the Fishbone Diagram to strengthen the risk management of a project. | ||
| − | |||
== Big idea == | == Big idea == | ||
| − | While the Fishbone Diagram was originally invented in order to analyze quality control, the tool has today found more common use in risk management and more specifically; risk identification | + | While the Fishbone Diagram was originally invented in order to analyze quality control, the tool has today found more common use in risk management and more specifically; risk identification <ref name=CauseEffect>Cause and Effect Analysis: Identifying the Likely Causes of Problems. (2017). Mind Tools. https://www.mindtools.com/pages/article/newTMC_03.htm</ref>. Risk identification tools are used throughout project, program and portfolio management domains; however, the large scale of programs and portfolios leads to less specific answers, which is why the word “cause” is often used instead of “root cause” as within complex environments, there is usually not a single cause that impacts the program/portfolio (Within the project management domain the term “root cause” is still applicable though). In general, there are multiple causes that can impact the program/portfolio system through various sections and should be dealt with from a holistic approach<ref name=PortMan>The Standard for Portfolio Management — Fourth Edition, Project Management Institute, 2017. ProQuest Ebook Central, https://ebookcentral-proquest-com.proxy.findit.dtu.dk/lib/DTUDK/detail.action?docID=5180852.</ref>. |
===Risk Management=== | ===Risk Management=== | ||
| − | |||
| − | Risk | + | [[File:Cascading Risk ManagementGHW.png|300px|thumb|Figure 1: Cascading Risk Management]] |
| − | + | In order to fully understand the purpose and application of the Fishbone Diagram it is important to know the importance of risk management for the success of a project/program/portfolio. Risk management is a branch within the uncertainty perspective of project management and an individual risk is an uncertain event that potentially can have a positive or negative effect on one or more objectives <ref name=PMbook>Geraldi, Joana, et al. Doing Projects. A Nordic Flavour to Managing Projects: DS-Handbook 185:2017. Dansk Standard, 2017</ref>, <ref name=PMIrisk>Project Management Institute, Inc. (PMI). (2019). Standard for Risk Management in Portfolios, Programs, and Projects. Project Management Institute, Inc. (PMI). Retrieved from | |
| + | [https://app.knovel.com/hotlink/toc/id:kpSRMPPP01/standard-risk-management/standard-risk-management]</ref>. Uncertainty is inherent in the nature of portfolios, programs, and projects. Risk arises out of uncertainty and generates uncertainty. The more risks one can identify, the more uncertainty is indicated<ref name=PMIrisk/>. These risks represent the exposure of the organization and its stakeholders to the consequences of uncertainty and can potentially define the success or failure of a project depending on how it is managed. Uncertainty is inherent in the nature of portfolios, programs, and projects. Risk arises out of uncertainty and generates uncertainty. The more risks one can identify, the more uncertainty is indicated<ref name=PMIrisk/>. | ||
| + | |||
| + | Risk management is a holistic approach that extends through organizational levels and is exercised to handle the natural uncertainty inherent in projects/programs/portfolios with the aim of supporting organizational objectives, realization of the strategic vision, and creation of value. Risk management has a large influence in decision making throughout the project, program and portfolio domains, which through systematic use of management tools can suggest actions for countering threats and exploiting unknown opportunities. | ||
| − | + | The multiple different approaches and perceptions regarding risk management in each portfolio, program, and project management domain feed into one another in an iterative, interactive, and dynamic manner. Risks may be interconnected, have dependencies, and interact via feedback loops as shown in figure XXX<ref name=PMIrisk/>. | |
===Risk Identification=== | ===Risk Identification=== | ||
| − | |||
| − | [[File:Risk identificationGHW.png|500px]] | + | [[File:Risk identificationGHW.png|500px|thumb|Figure 2: Risk identification]] |
| + | |||
| + | [[File:FishboneGHW.png|600px|thumb|Figure 3: Fishbone Diagram]] | ||
| + | |||
| + | In the risk identification section this article will mainly focus on risk identification in project management, however many of the tools and thoughts discussed in this section can be applied to both program and portfolio management. Risk identification is process of uncovering individual project uncertainty as well as sources of overall project risk while documenting the characteristics. The main benefit of identifying the risks of a project is that the process maps out potential dangers to the project while also providing information so that the project team can develop the appropriate response to the identified risk. This process is performed iteratively throughout the project. Popular inputs, tools and techniques, and outputs of the process are illustrated in the figure 2<ref name=ProjMan>Project Management Institute, Inc.. (2017). Guide to the Project Management Body of Knowledge (PMBOK® Guide) (6th Edition). Project Management Institute, Inc. (PMI). Retrieved from | ||
| + | https://app.knovel.com/hotlink/toc/id:kpGPMBKP02/guide-project-management/guide-project-management.</ref>. | ||
| + | |||
| + | In risk identification Fishbone Diagrams are typically used for root cause analysis. Root cause analysis is typically used to discover the root of the causes that lead to a problem/challenge with the main objective of developing preventive actions. It can be used to map potential project risks by investigating a problem statement and then explore which threats might stimulate the investigated problem. However, root cause analysis can also be used to find potential opportunities within a project by starting with a beneficial problem statement and explore which events may trigger that benefit<ref name=ProjMan/>. | ||
| + | |||
| + | Figure 3 depicts the structure of the Fishbone Diagram, where the problem statement or effect is located in the “fish head”. This could be “customers complain of poor service”. From here multiple “fish bones” represent different causes to the problem statement, which could be “staff” or “long waiting time”. The causes are then split into sub-causes or “ribs”, which help further analyze and identify the causes that have the greatest impact, which will then lead to the root of the problem. The process of making new "ribs" on the fish continues until the team agrees that the root cause has been reached. By dissipating the problem into smaller more manageable issues, which have a large impact on the problem, it makes the problem-solving process easier and more effective<ref name=Diagram5W>City Process Management. (2008). Cause and Effect Analysis using the Ishikawa Fishbone & 5 Whys. Http://Www.Cityprocessmanagement.Com/Downloads/CPM_5Ys.Pdf. http://www.cityprocessmanagement.com/Downloads/CPM_5Ys.pdf</ref>. | ||
| + | |||
| + | In order to effectively solve the root causes identified through the Fishbone Diagram and develop preventive actions, it is important to evaluate the probability and investment required in order to solve the problem. For this process the project team should focus on causes that are “Very High” or “High” in probability and “Very High” or “High” in impact” in the Probability/Impact, which will be discussed in the Application chapter <ref name=PMbook />. This exercise is carried out to avoid wasting time and effort developing preventive actions for a cause that is either unlikely to happen or expensive/impossible to treat. | ||
| + | |||
| + | |||
| + | |||
| + | |||
| − | |||
| − | |||
| Line 34: | Line 47: | ||
| − | |||
== Application == | == Application == | ||
| − | + | The following section will describe how to use the Fishbone Diagram in a step-by-step guide, which should fully equip the reader with all the necessary information to apply the method after reading this article. | |
| − | + | ===Step 1: Identify the problem or opportunity=== | |
| + | The first step in the application of the Fishbone Diagram is to write down the problem statement or effect that you wish to analyze. It is important to think about who is involved, what the problem is, and when and where it occurs. Then write this problem statement in a box/head on the right-hand side on a blank surface. This could be a whiteboard, large sheet of paper or electronically depending on preferences. From the box with the problem statement draw a line across the paper horizontally. This arrangement will be the head and the spine of the fish and will provide the main structure for brainstorming ideas. | ||
| + | Then, write the problem in a box on the left-hand side of a large sheet of paper, and draw a line across the paper horizontally from the box. This arrangement, looking like the head and spine of a fish, gives you space to develop ideas<ref name=CauseEffect/>. | ||
| − | + | [[File:Step1GHW.png|600px|thumb|left|Figure 4: Step 1]] | |
| − | + | ||
| − | + | ||
| − | |||
| − | |||
| − | |||
| − | |||
| − | |||
| − | |||
| − | |||
| − | |||
| − | |||
| − | |||
| − | |||
| − | |||
| − | |||
| − | + | ||
| + | |||
| + | |||
| + | |||
| + | |||
| + | |||
| + | |||
| + | |||
| + | ===Step 2: Identify the main causes involved=== | ||
| + | The next step is to identify the causes or factors that may be involved. Potential causes could be systems, equipment, materials, external forces, people involved with the problem, and so on. Try to think of as many causes as possible. Later, causes commonly used for tackling problems from specific sectors will be introduced, but for now you should focus on your problem statement. Write down the identified causes and draw a line from each cause to the spine of the diagram<ref name=CauseEffect/>. | ||
| + | |||
| + | [[File:Step2GHW.png|600px|thumb|left|Figure 5: Step 2]] | ||
| + | |||
| + | |||
| + | |||
| + | |||
| + | |||
| + | |||
| + | |||
| + | |||
| + | |||
| + | |||
| + | |||
| + | |||
| + | |||
| + | |||
| + | |||
| + | |||
| + | |||
| + | |||
| + | |||
| + | |||
| + | |||
| + | |||
| + | |||
| + | |||
| + | |||
| + | |||
| + | |||
| + | |||
| + | |||
| + | |||
| + | |||
| + | |||
| + | |||
| + | |||
| + | |||
| + | |||
| + | ===Step 3: Identify possible sub-causes=== | ||
| + | For each of the main causes involved there will now be considered possible sub-causes. The sub-causes will be fitted into the diagram by drawing horizontal lines from the “bones”. The number of necessary sub-causes and level of detail is largely up to the project team and the complexity of the problem statement. The process of dividing causes into sub-causes can be iterated an infinite amount of times or until the project team has reached the desired level of detail<ref name=CauseEffect/>. | ||
| + | |||
| + | [[File:FishboneGHW.png|600px|thumb|left|Figure 6: Step 3]] | ||
| + | |||
| + | |||
| + | |||
| + | |||
| + | |||
| + | |||
| + | |||
| + | |||
| + | |||
| + | |||
| + | |||
| + | |||
| + | |||
| + | |||
| + | |||
| + | |||
| + | |||
| + | |||
| + | |||
| + | |||
| + | |||
| + | |||
| + | |||
| + | |||
| + | |||
| + | |||
| + | |||
| + | |||
| + | |||
| + | |||
| + | ===Step 4: Finishing touches=== | ||
| + | All that is left to do is finish the diagram up with a tail and you are ready to analyze the diagram. | ||
| + | |||
| + | [[File:Step4GHW.png|600px|thumb|left|Figure 7: Step 4]] | ||
| + | |||
| + | |||
| + | |||
| + | |||
| + | |||
| + | |||
| + | |||
| + | |||
| + | |||
| + | |||
| + | |||
| + | |||
| + | |||
| + | |||
| + | |||
| + | |||
| + | |||
| + | |||
| + | |||
| + | |||
| + | |||
| + | |||
| + | |||
| + | |||
| + | |||
| + | |||
| + | |||
| + | |||
| + | |||
| + | |||
| + | |||
| + | ===Step 5: Analysis of the Fishbone Diagram=== | ||
| + | At this point the Fishbone Diagram should be complete and showing all of the possible causes to the problem statement that the project team could think of. It is now possible to begin the analysis diagram in order to identify the most important causes. Depending on the complexity and importance of the problem, you can now investigate the most likely causes further. This may involve setting up investigations, carrying out surveys, and so on. On the basis of this systematic approach, it is now possible to develop solutions to the root cause, which should be the goal of the cause analysis<ref name=CauseEffect/>. | ||
| + | |||
| + | This step-by-step guide can easily give the image that the construction of a Fishbone Diagram is a very linear process. However, it often happens that the project teams fill out a cause with sub-causes before making the next or once they have filled out all the causes recognize that some of the sub-causes from several of the causes are linked and creating a new cause “bone” especially for them is the most appropriate way of treating them. It is encouraged that the teams go back in steps to alter the diagram. It means that the team has acquired new knowledge throughout the making of the diagram and is figuring out something new about the project. | ||
| + | |||
| + | ===Area of application=== | ||
| + | [[File:FishboneDubbeGHW.png|300px|thumb|Figure 8: Fishbone application]] | ||
| + | While this article has already covered the use of the Fishbone Diagram to identify root causes in great depth, it will now identify some of the most common application sectors and how the tool is modified and standardized in order to best accommodate the specific area of application. Figure XXX provides an overview of common uses and the possibilities of the Fishbone Diagram<ref name=Loredana2017>MIHAELA LOREDANA, E. CO BI CI. “THE ANALYSIS OF CAUSES AND EFFECTS OF A PHENOMENON BY MEANS OF THE ‘FISHBONE’ DIAGRAM.” Analele Universităţii Constantin Brâncuşi Din Târgu Jiu : Seria Economie, Academica Brâncuşi, 2017.</ref>. | ||
| + | |||
| + | The three most common areas the Fishbone Diagram is used is manufacturing, services and product marketing, all three of which has adapted and modified the Fishbone Diagram in order to better suit their specific problem area and find common causes. | ||
| + | |||
| + | ===Manufacturing=== | ||
| + | When used for root cause analysis in the manufacturing sector, the Fishbone Diagram is often modified to fit the 5M Model: | ||
| + | |||
| + | • Man (people): including the physiology and psychology of those involved, as well as their performance and proficiency. | ||
| + | |||
| + | • Machine (equipment): including the design, manufacture, maintenance, reliability, performance, etc. | ||
| + | |||
| + | • Medium / measurement (environment, inspection): including weather, terrain, obstructions, lighting, etc. | ||
| + | |||
| + | • Mission (purpose): the reason these three factors are brought together. | ||
| + | |||
| + | • Management (leadership): the prevailing supervisory approach in terms of regulations, policies, procedures, and attitude involved in establishing, operating, maintaining, and decommissioning. | ||
| + | |||
| + | [[File:5MSGHW.png|600px]] | ||
| + | |||
| + | These have been expanded by some to include an additional three, and are referred to as the 8M Model: | ||
| + | |||
| + | • Material (includes raw material, consumables, and information) | ||
| + | |||
| + | • Method / mother nature (process, environment) | ||
| + | |||
| + | • Maintenance | ||
| + | |||
| + | [[File:8MSGHW.png|600px]] | ||
| + | |||
| + | ===Services=== | ||
| + | In the service industry the Fishbone Diagram is build up around the 4S Model: | ||
| + | |||
| + | • Surroundings | ||
| + | |||
| + | • Suppliers | ||
| + | |||
| + | • Systems | ||
| + | |||
| + | • Skill | ||
| + | |||
| + | [[File:4SGHW.png|600px]] | ||
| + | |||
| + | ===Product marketing=== | ||
| + | The 8P Model is commonly used for identifying crucial attributes for planning in product marketing and is also often used in root-cause analysis as causes for the Fishbone Diagram: | ||
| + | |||
| + | • Product (or service) | ||
| + | |||
| + | • Price | ||
| + | |||
| + | • Place | ||
| + | |||
| + | • Promotion | ||
| + | |||
| + | • People (personnel) | ||
| + | |||
| + | • Process | ||
| + | |||
| + | • Physical evidence (proof) | ||
| + | |||
| + | • Performance | ||
| + | |||
| + | [[File:8PGHW.png|600px]] | ||
| + | |||
| + | ===Combination tools=== | ||
| + | The Fishbone Diagram can be used in combination with many different tools used within project, program and portfolio management. It is naturally used in conjunction with Brainstorming as this tool is used when coming up with new causes and sub-causes. A Mind Map is also naturally occurring when using the Fishbone Diagram as it helps structure and link the causes and sub-causes from the Brainstorming into groups, which can then be inserted into the Fishbone Diagram as the “bones”. Another popular tool to use in combination with the Fishbone Diagram, is the 5 Why’s; a tool that forces the user into thinking of five causes, give or take one, to a given problem until the root causes have been found. However, knowing when to stop is important, or else the project team risks “analysis by paralysis” and frustration. Use common sense. A useful indicator of when to stop generating new causes, is when the cause is more than one level of management removed from the group<ref name=Diagram5W/>. | ||
| + | |||
| + | The Probability/Impact Matrix is often used together with the Fishbone Diagram, and while the other tools presented in this chapter are related to generating ideas for new causes, the Probability/Impact Matrix is a tool that helps structuring which causes should be treated and thus identifying the causes with the greatest impact <ref name=PMbook />. When used, the project team should focus on causes within the red and orange areas of the Probability/Impact Matrix illustrated in figure 13. | ||
| + | |||
| + | [[File:ProbImpMatrixGHW.png|600px]] | ||
| + | |||
| + | |||
| + | == Limitations == | ||
| + | While the Fishbone Diagram is a tool with many possible applications, it is important to know when to use and when not to use it in order to avoid cognitive bias such as the Law of the Instrument (also known as Law of the Hammer), where an over-reliance on a familiar tool will make the user treat every problem the same (''“I suppose it is tempting, if the only tool you have is a hammer, to treat everything as if it were a nail”'') <ref name=LawofInstrument>The Decision Lab. (2021, January 22). Law of the instrument - Biases & Heuristics. https://thedecisionlab.com/biases/law-of-the-instrument/</ref>. The Fishbone Diagram’s primary function is to identify structure potential root causes to a problem. Thus, the tool itself is not meant to develop solutions to the specific root causes. It is therefore solely used to structure and contextualize root causes and it is then up to the project team to develop solutions based on the highlighted issues. Also, the tool cannot help the project team find the best way of executing the necessary actions, and while the tool is an important part of the risk identification process, it does not substitute the need for other tools and methods within this process. If the project team only uses the Fishbone Diagram, they might be attentive of certain risks, but they will perhaps miss others and it will bring them no closer to developing a risk management solution. | ||
| + | |||
| + | Another important limitation with the Fishbone Diagram is that, as with any other tool, it is only as good as the people, who use it. Often a single person or a project team consisting of very like-minded people will miss causes or miss assess the importance of a cause. It is due to this reason, that the above-mentioned industry standards for Fishbone Diagrams exists, as it ensures that the project team at least will consider the most important aspects of a problem. To avoid these errors, it is important to consider individual expertise when constructing projects teams. A diverse team can be an advantage in any brainstorming activity, and this is certainly also the case when using the Fishbone Diagram. The main purpose for being a diverse project team is to avoid brainstorming rut, gaps of knowledge and cognitive bias. It is recommended that the projects team consists of experts within each cause-area as well as people with a more holistic perspective of the problem. However, it is also important to note, that a too diverse team can cause conflicts and challenges in the internal discussion and through valuing the important of root causes. It is therefore important to have common ground on how to grade the likelihood and impact of each root cause. Otherwise, this can potentially lead to some root causes being underestimated while others are overestimated, so that some root causes will not get the required attention and risk management, which potentially could have critical impact on the final outcome of the project. | ||
| + | |||
| + | == Annotated bibliography == | ||
| + | '''PMI Standard for Risk Management:''' The PMI standard for Risk Management is the most current standard for Risk Management in project, program and portfolio management and provides comprehensive guidance and information regarding risk management in all aspects of project/program/portfolio management. | ||
| + | |||
| + | '''Project Management: A guide to the Project Management Body of Knowledge (PMBOK guide):''' Provides an insight into the status quo of project management and will further explain the need for risk management and risk identification in projects. | ||
| + | |||
| + | '''Cause and Effect Analysis using the Ishikawa Fishbone & 5 Whys:''' Provides an interesting insight into the use of the Fishbone Diagram in combination with the 5 Why’s including a thorough step-by-step guide. | ||
| + | |||
| + | '''Cause and Effect Analysis: Identifying the Likely Causes of Problems:''' Provides an easy hands-on guide to cause and effect analysis through the Fishbone Diagram and includes both video and written guidance. | ||
| + | |||
| + | '''THE ANALYSIS OF CAUSES AND EFFECTS OF A PHENOMENON BY MEANS OF THE ‘FISHBONE’ DIAGRAM:''' | ||
| + | Provides a thorough analysis of the application of Fishbone Diagrams and how to discover root causes. | ||
| + | |||
| + | == References == | ||
| + | <references /> | ||
Latest revision as of 08:09, 24 February 2021
[edit] Abstract
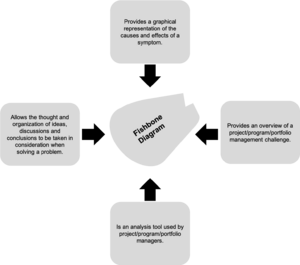
The Fishbone Diagram is a helpful tool used in root cause analysis and is used to figure out cause-and-effect and to breakdown the contributing factors of an issue. The tool was originally invented by Professor Kaoru Ishikawa, a Japanese organizational theorist and pioneer of quality management, in the 1960s and published in his book “Introduction to Quality Control”. The tool was originally known as Ishikawa Diagrams, however due to its resemblance of a fish skeleton it is now commonly referred to as the Fishbone Diagram. The tool’s original intention was to analyze quality control; however, it has since then been applied in many situations and now mostly turned towards identification of root causes for problems.
The main objective of a Fishbone Diagram is to break down and organize the causes of an issue to reveal the elements that have the greatest impact. By grouping these causes into different categories means that you can think about the different element of the problem as separate from the overall issue. From here it should be possible to identify one or two of these causes to have the greater impact, which will then lead to the root of the problem. This structure also allows you to tackle smaller issues which have a large impact on the problem and thus making problem solving more manageable. This has made it a valuable tool for uncertainty and risk identification as it can help identifying how to best handle potential risks.
This article aims to provide an overview of how the diagram is best used as a risk management tool as well as discussing application and limitations. Hereby also mentioning different tools that can be used in combination with the Fishbone Diagram to strengthen the risk management of a project.
[edit] Big idea
While the Fishbone Diagram was originally invented in order to analyze quality control, the tool has today found more common use in risk management and more specifically; risk identification [1]. Risk identification tools are used throughout project, program and portfolio management domains; however, the large scale of programs and portfolios leads to less specific answers, which is why the word “cause” is often used instead of “root cause” as within complex environments, there is usually not a single cause that impacts the program/portfolio (Within the project management domain the term “root cause” is still applicable though). In general, there are multiple causes that can impact the program/portfolio system through various sections and should be dealt with from a holistic approach[2].
[edit] Risk Management
In order to fully understand the purpose and application of the Fishbone Diagram it is important to know the importance of risk management for the success of a project/program/portfolio. Risk management is a branch within the uncertainty perspective of project management and an individual risk is an uncertain event that potentially can have a positive or negative effect on one or more objectives [3], [4]. Uncertainty is inherent in the nature of portfolios, programs, and projects. Risk arises out of uncertainty and generates uncertainty. The more risks one can identify, the more uncertainty is indicated[4]. These risks represent the exposure of the organization and its stakeholders to the consequences of uncertainty and can potentially define the success or failure of a project depending on how it is managed. Uncertainty is inherent in the nature of portfolios, programs, and projects. Risk arises out of uncertainty and generates uncertainty. The more risks one can identify, the more uncertainty is indicated[4].
Risk management is a holistic approach that extends through organizational levels and is exercised to handle the natural uncertainty inherent in projects/programs/portfolios with the aim of supporting organizational objectives, realization of the strategic vision, and creation of value. Risk management has a large influence in decision making throughout the project, program and portfolio domains, which through systematic use of management tools can suggest actions for countering threats and exploiting unknown opportunities.
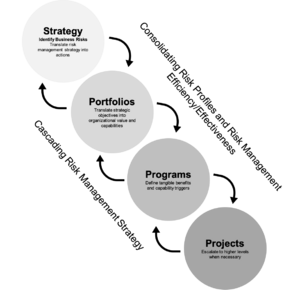
The multiple different approaches and perceptions regarding risk management in each portfolio, program, and project management domain feed into one another in an iterative, interactive, and dynamic manner. Risks may be interconnected, have dependencies, and interact via feedback loops as shown in figure XXX[4].
[edit] Risk Identification
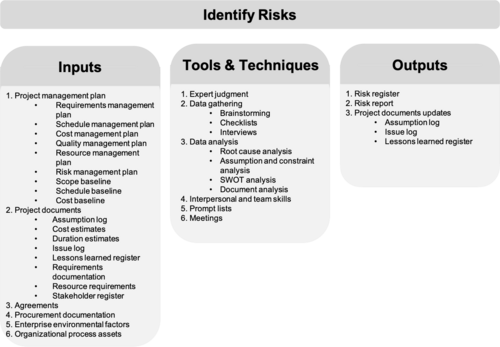
In the risk identification section this article will mainly focus on risk identification in project management, however many of the tools and thoughts discussed in this section can be applied to both program and portfolio management. Risk identification is process of uncovering individual project uncertainty as well as sources of overall project risk while documenting the characteristics. The main benefit of identifying the risks of a project is that the process maps out potential dangers to the project while also providing information so that the project team can develop the appropriate response to the identified risk. This process is performed iteratively throughout the project. Popular inputs, tools and techniques, and outputs of the process are illustrated in the figure 2[5].
In risk identification Fishbone Diagrams are typically used for root cause analysis. Root cause analysis is typically used to discover the root of the causes that lead to a problem/challenge with the main objective of developing preventive actions. It can be used to map potential project risks by investigating a problem statement and then explore which threats might stimulate the investigated problem. However, root cause analysis can also be used to find potential opportunities within a project by starting with a beneficial problem statement and explore which events may trigger that benefit[5].
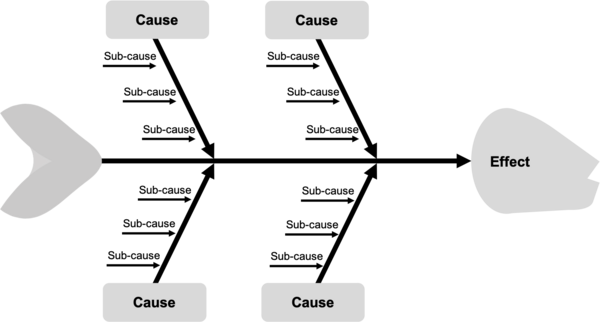
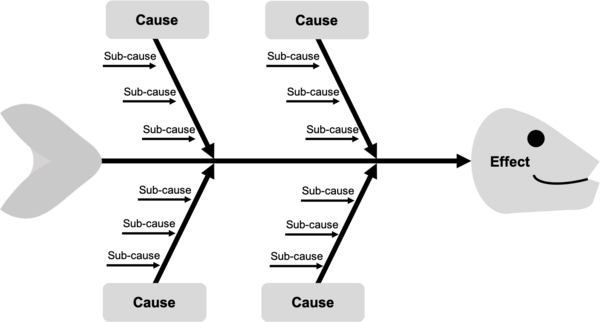
Figure 3 depicts the structure of the Fishbone Diagram, where the problem statement or effect is located in the “fish head”. This could be “customers complain of poor service”. From here multiple “fish bones” represent different causes to the problem statement, which could be “staff” or “long waiting time”. The causes are then split into sub-causes or “ribs”, which help further analyze and identify the causes that have the greatest impact, which will then lead to the root of the problem. The process of making new "ribs" on the fish continues until the team agrees that the root cause has been reached. By dissipating the problem into smaller more manageable issues, which have a large impact on the problem, it makes the problem-solving process easier and more effective[6].
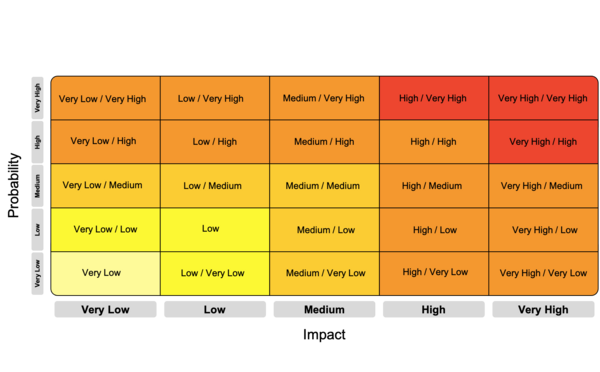
In order to effectively solve the root causes identified through the Fishbone Diagram and develop preventive actions, it is important to evaluate the probability and investment required in order to solve the problem. For this process the project team should focus on causes that are “Very High” or “High” in probability and “Very High” or “High” in impact” in the Probability/Impact, which will be discussed in the Application chapter [3]. This exercise is carried out to avoid wasting time and effort developing preventive actions for a cause that is either unlikely to happen or expensive/impossible to treat.
[edit] Application
The following section will describe how to use the Fishbone Diagram in a step-by-step guide, which should fully equip the reader with all the necessary information to apply the method after reading this article.
[edit] Step 1: Identify the problem or opportunity
The first step in the application of the Fishbone Diagram is to write down the problem statement or effect that you wish to analyze. It is important to think about who is involved, what the problem is, and when and where it occurs. Then write this problem statement in a box/head on the right-hand side on a blank surface. This could be a whiteboard, large sheet of paper or electronically depending on preferences. From the box with the problem statement draw a line across the paper horizontally. This arrangement will be the head and the spine of the fish and will provide the main structure for brainstorming ideas.
Then, write the problem in a box on the left-hand side of a large sheet of paper, and draw a line across the paper horizontally from the box. This arrangement, looking like the head and spine of a fish, gives you space to develop ideas[1].
[edit] Step 2: Identify the main causes involved
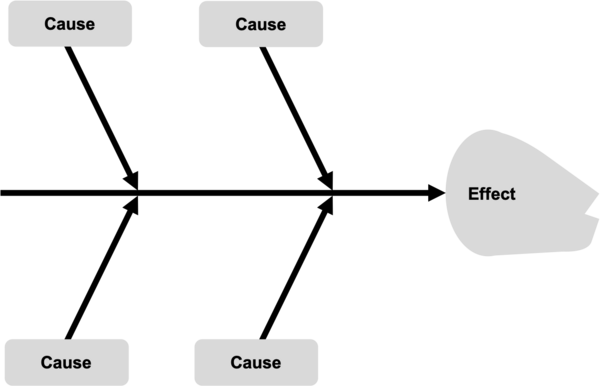
The next step is to identify the causes or factors that may be involved. Potential causes could be systems, equipment, materials, external forces, people involved with the problem, and so on. Try to think of as many causes as possible. Later, causes commonly used for tackling problems from specific sectors will be introduced, but for now you should focus on your problem statement. Write down the identified causes and draw a line from each cause to the spine of the diagram[1].
[edit] Step 3: Identify possible sub-causes
For each of the main causes involved there will now be considered possible sub-causes. The sub-causes will be fitted into the diagram by drawing horizontal lines from the “bones”. The number of necessary sub-causes and level of detail is largely up to the project team and the complexity of the problem statement. The process of dividing causes into sub-causes can be iterated an infinite amount of times or until the project team has reached the desired level of detail[1].
[edit] Step 4: Finishing touches
All that is left to do is finish the diagram up with a tail and you are ready to analyze the diagram.
[edit] Step 5: Analysis of the Fishbone Diagram
At this point the Fishbone Diagram should be complete and showing all of the possible causes to the problem statement that the project team could think of. It is now possible to begin the analysis diagram in order to identify the most important causes. Depending on the complexity and importance of the problem, you can now investigate the most likely causes further. This may involve setting up investigations, carrying out surveys, and so on. On the basis of this systematic approach, it is now possible to develop solutions to the root cause, which should be the goal of the cause analysis[1].
This step-by-step guide can easily give the image that the construction of a Fishbone Diagram is a very linear process. However, it often happens that the project teams fill out a cause with sub-causes before making the next or once they have filled out all the causes recognize that some of the sub-causes from several of the causes are linked and creating a new cause “bone” especially for them is the most appropriate way of treating them. It is encouraged that the teams go back in steps to alter the diagram. It means that the team has acquired new knowledge throughout the making of the diagram and is figuring out something new about the project.
[edit] Area of application
While this article has already covered the use of the Fishbone Diagram to identify root causes in great depth, it will now identify some of the most common application sectors and how the tool is modified and standardized in order to best accommodate the specific area of application. Figure XXX provides an overview of common uses and the possibilities of the Fishbone Diagram[7].
The three most common areas the Fishbone Diagram is used is manufacturing, services and product marketing, all three of which has adapted and modified the Fishbone Diagram in order to better suit their specific problem area and find common causes.
[edit] Manufacturing
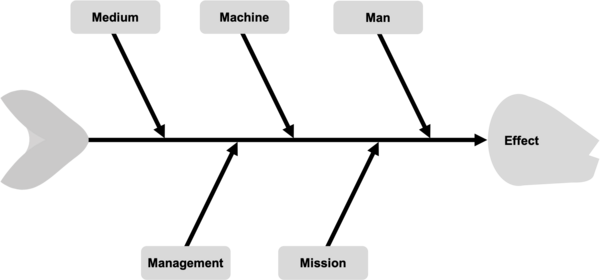
When used for root cause analysis in the manufacturing sector, the Fishbone Diagram is often modified to fit the 5M Model:
• Man (people): including the physiology and psychology of those involved, as well as their performance and proficiency.
• Machine (equipment): including the design, manufacture, maintenance, reliability, performance, etc.
• Medium / measurement (environment, inspection): including weather, terrain, obstructions, lighting, etc.
• Mission (purpose): the reason these three factors are brought together.
• Management (leadership): the prevailing supervisory approach in terms of regulations, policies, procedures, and attitude involved in establishing, operating, maintaining, and decommissioning.
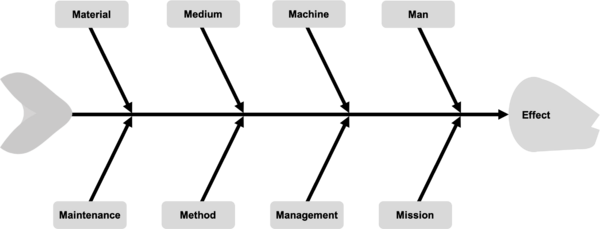
These have been expanded by some to include an additional three, and are referred to as the 8M Model:
• Material (includes raw material, consumables, and information)
• Method / mother nature (process, environment)
• Maintenance
[edit] Services
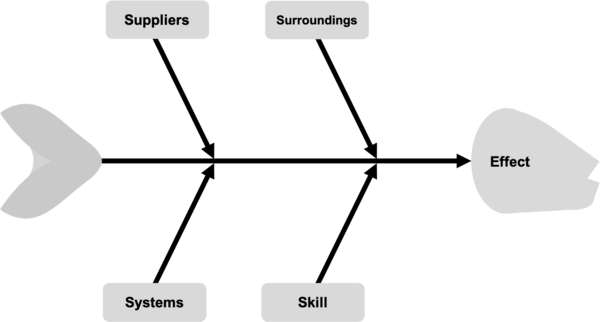
In the service industry the Fishbone Diagram is build up around the 4S Model:
• Surroundings
• Suppliers
• Systems
• Skill
[edit] Product marketing
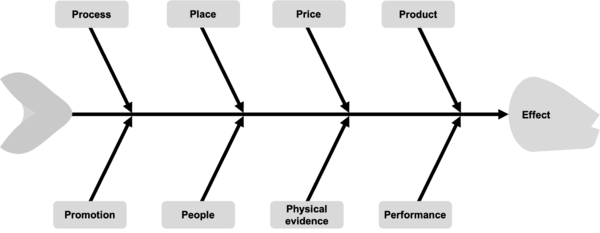
The 8P Model is commonly used for identifying crucial attributes for planning in product marketing and is also often used in root-cause analysis as causes for the Fishbone Diagram:
• Product (or service)
• Price
• Place
• Promotion
• People (personnel)
• Process
• Physical evidence (proof)
• Performance
[edit] Combination tools
The Fishbone Diagram can be used in combination with many different tools used within project, program and portfolio management. It is naturally used in conjunction with Brainstorming as this tool is used when coming up with new causes and sub-causes. A Mind Map is also naturally occurring when using the Fishbone Diagram as it helps structure and link the causes and sub-causes from the Brainstorming into groups, which can then be inserted into the Fishbone Diagram as the “bones”. Another popular tool to use in combination with the Fishbone Diagram, is the 5 Why’s; a tool that forces the user into thinking of five causes, give or take one, to a given problem until the root causes have been found. However, knowing when to stop is important, or else the project team risks “analysis by paralysis” and frustration. Use common sense. A useful indicator of when to stop generating new causes, is when the cause is more than one level of management removed from the group[6].
The Probability/Impact Matrix is often used together with the Fishbone Diagram, and while the other tools presented in this chapter are related to generating ideas for new causes, the Probability/Impact Matrix is a tool that helps structuring which causes should be treated and thus identifying the causes with the greatest impact [3]. When used, the project team should focus on causes within the red and orange areas of the Probability/Impact Matrix illustrated in figure 13.
[edit] Limitations
While the Fishbone Diagram is a tool with many possible applications, it is important to know when to use and when not to use it in order to avoid cognitive bias such as the Law of the Instrument (also known as Law of the Hammer), where an over-reliance on a familiar tool will make the user treat every problem the same (“I suppose it is tempting, if the only tool you have is a hammer, to treat everything as if it were a nail”) [8]. The Fishbone Diagram’s primary function is to identify structure potential root causes to a problem. Thus, the tool itself is not meant to develop solutions to the specific root causes. It is therefore solely used to structure and contextualize root causes and it is then up to the project team to develop solutions based on the highlighted issues. Also, the tool cannot help the project team find the best way of executing the necessary actions, and while the tool is an important part of the risk identification process, it does not substitute the need for other tools and methods within this process. If the project team only uses the Fishbone Diagram, they might be attentive of certain risks, but they will perhaps miss others and it will bring them no closer to developing a risk management solution.
Another important limitation with the Fishbone Diagram is that, as with any other tool, it is only as good as the people, who use it. Often a single person or a project team consisting of very like-minded people will miss causes or miss assess the importance of a cause. It is due to this reason, that the above-mentioned industry standards for Fishbone Diagrams exists, as it ensures that the project team at least will consider the most important aspects of a problem. To avoid these errors, it is important to consider individual expertise when constructing projects teams. A diverse team can be an advantage in any brainstorming activity, and this is certainly also the case when using the Fishbone Diagram. The main purpose for being a diverse project team is to avoid brainstorming rut, gaps of knowledge and cognitive bias. It is recommended that the projects team consists of experts within each cause-area as well as people with a more holistic perspective of the problem. However, it is also important to note, that a too diverse team can cause conflicts and challenges in the internal discussion and through valuing the important of root causes. It is therefore important to have common ground on how to grade the likelihood and impact of each root cause. Otherwise, this can potentially lead to some root causes being underestimated while others are overestimated, so that some root causes will not get the required attention and risk management, which potentially could have critical impact on the final outcome of the project.
[edit] Annotated bibliography
PMI Standard for Risk Management: The PMI standard for Risk Management is the most current standard for Risk Management in project, program and portfolio management and provides comprehensive guidance and information regarding risk management in all aspects of project/program/portfolio management.
Project Management: A guide to the Project Management Body of Knowledge (PMBOK guide): Provides an insight into the status quo of project management and will further explain the need for risk management and risk identification in projects.
Cause and Effect Analysis using the Ishikawa Fishbone & 5 Whys: Provides an interesting insight into the use of the Fishbone Diagram in combination with the 5 Why’s including a thorough step-by-step guide.
Cause and Effect Analysis: Identifying the Likely Causes of Problems: Provides an easy hands-on guide to cause and effect analysis through the Fishbone Diagram and includes both video and written guidance.
THE ANALYSIS OF CAUSES AND EFFECTS OF A PHENOMENON BY MEANS OF THE ‘FISHBONE’ DIAGRAM: Provides a thorough analysis of the application of Fishbone Diagrams and how to discover root causes.
[edit] References
- ↑ 1.0 1.1 1.2 1.3 1.4 Cause and Effect Analysis: Identifying the Likely Causes of Problems. (2017). Mind Tools. https://www.mindtools.com/pages/article/newTMC_03.htm
- ↑ The Standard for Portfolio Management — Fourth Edition, Project Management Institute, 2017. ProQuest Ebook Central, https://ebookcentral-proquest-com.proxy.findit.dtu.dk/lib/DTUDK/detail.action?docID=5180852.
- ↑ 3.0 3.1 3.2 Geraldi, Joana, et al. Doing Projects. A Nordic Flavour to Managing Projects: DS-Handbook 185:2017. Dansk Standard, 2017
- ↑ 4.0 4.1 4.2 4.3 Project Management Institute, Inc. (PMI). (2019). Standard for Risk Management in Portfolios, Programs, and Projects. Project Management Institute, Inc. (PMI). Retrieved from [1]
- ↑ 5.0 5.1 Project Management Institute, Inc.. (2017). Guide to the Project Management Body of Knowledge (PMBOK® Guide) (6th Edition). Project Management Institute, Inc. (PMI). Retrieved from https://app.knovel.com/hotlink/toc/id:kpGPMBKP02/guide-project-management/guide-project-management.
- ↑ 6.0 6.1 City Process Management. (2008). Cause and Effect Analysis using the Ishikawa Fishbone & 5 Whys. Http://Www.Cityprocessmanagement.Com/Downloads/CPM_5Ys.Pdf. http://www.cityprocessmanagement.com/Downloads/CPM_5Ys.pdf
- ↑ MIHAELA LOREDANA, E. CO BI CI. “THE ANALYSIS OF CAUSES AND EFFECTS OF A PHENOMENON BY MEANS OF THE ‘FISHBONE’ DIAGRAM.” Analele Universităţii Constantin Brâncuşi Din Târgu Jiu : Seria Economie, Academica Brâncuşi, 2017.
- ↑ The Decision Lab. (2021, January 22). Law of the instrument - Biases & Heuristics. https://thedecisionlab.com/biases/law-of-the-instrument/
