Hoshin Kanri
(→A3-i: Competitive information report) |
|||
| (57 intermediate revisions by one user not shown) | |||
| Line 1: | Line 1: | ||
| + | ''Developed by Davide Sartori'' | ||
| + | |||
== Abstract == | == Abstract == | ||
| − | The point of convergence for this article is to present and explain the "Hoshin Kanri" (or Policy Deployment) method, presented by Dr. Yoji Akao, a leading Japanese author, in ''Hoshin Kanri: Policy deployment for successful TQM'' (1991). Hoshin Kanri is defined as a "form of corporate-wide management that combines strategic management and operational management by linking the achievement of top management goals with daily management at an operation level <ref name="a"> ''Policy management of strategy (hoshin kanri) ,Barry J. Witcher, School of Management, University of East Anglia, UK''</ref>. This method is an essential support for TQM <ref name="b"> ''USING QFD TO DRIVE TQM IMPLEMENTATION,Dr. Robert A Hunt,Director Centre for Management Innovation and Technology Graduate School of Management, Macquarie University,Sydney, Australia 2109.''</ref> and is based on the PDCA cycle. Hence, at the strategic level, the method can be applied by scanning the context of the company in order to further understand how to position in the market. To do that, the external and the internal environments need to be studied utilizing the Porter's 5 forces analysis and the Porter's generic strategies (for the external environment). On the other hand, for the internal environment, which is about understanding the available resources of the company in order to develop a competitive strategy, a Business Model Canvas, SWOT analysis or a Balanced Scorecard is more applicable. Subsequently, during the planning step, the long and mid-short term goals are decided and through the X-Matrix, which is the way of implementing the Hoshin Kanri, the operational and organizational goals are aligned. After the implementation, the progress has to be continuously monitored, keeping track of all the activities and improving them. Furthermore, the article will give attention to the Catchball process, which is a necessary communication process aiming to obtain successful implementation of the Hoshin Kanri throughout all of the company levels. | + | The point of convergence for this article is to present and explain the "Hoshin Kanri" (or Policy Deployment) method, presented by Dr. Yoji Akao, a leading Japanese author, in ''Hoshin Kanri: Policy deployment for successful TQM'' (1991). Hoshin Kanri is defined as a "form of corporate-wide management that combines strategic management and operational management by linking the achievement of top management goals with daily management at an operation level <ref name="a"> ''Policy management of strategy (hoshin kanri) ,Barry J. Witcher, School of Management, University of East Anglia, UK''</ref>. This method is an essential support for TQM <ref name="b"> ''USING QFD TO DRIVE TQM IMPLEMENTATION,Dr. Robert A Hunt,Director Centre for Management Innovation and Technology Graduate School of Management, Macquarie University,Sydney, Australia 2109.''</ref> and is based on the PDCA cycle. Hence, at the strategic level, the method can be applied by scanning the context of the company in order to further understand how to position in the market. To do that, the external and the internal environments need to be studied utilizing the Porter's 5 forces analysis and the Porter's generic strategies (for the external environment). On the other hand, for the internal environment, which is about understanding the available resources of the company in order to develop a competitive strategy, a Business Model Canvas, a Product/Market matrix, a Importance/Performance matrix, a SWOT analysis or a Balanced Scorecard is more applicable. Subsequently, during the planning step, the long and mid-short term goals are decided and through the X-Matrix, which is the way of implementing the Hoshin Kanri, the operational and organizational goals are aligned. After the implementation, the progress has to be continuously monitored, keeping track of all the activities and improving them. Furthermore, the article will give attention to the Catchball process, which is a necessary communication process aiming to obtain successful implementation of the Hoshin Kanri throughout all of the company levels. |
== Different names of Hoshin Kanri == | == Different names of Hoshin Kanri == | ||
| Line 7: | Line 9: | ||
== The Hoshin Kanri == | == The Hoshin Kanri == | ||
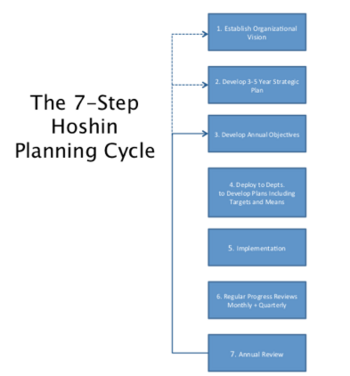
| − | [[File:7step.png|thumb|right|350px| Figure 1: The seven steps of Hoshin | + | [[File:7step.png|thumb|right|350px| Figure 1: The seven steps of Hoshin Kanri <ref name="r"> ''Roberto Panizzolo, Università degli studi di Padova, Gestione snella dei processi, 4 October 2017.''</ref>.]] |
Hoshin Kanri, or Policy Deployment, is a strategic planning tool used to manage complex portfolio management processes in lean enterprises. It combines the strategic management with the daily management, tying up the long-term activities with the daily ones <ref name="e"> ''HOSHIN KANRI: POLICY MANAGEMENT IN JAPANESE-OWNED UK SUBSIDIARIES, Barry J. Witcher and Rosemary Butterworth, Journal of Management Studies 38:5 July 2001, University of East Anglia.''</ref>. | Hoshin Kanri, or Policy Deployment, is a strategic planning tool used to manage complex portfolio management processes in lean enterprises. It combines the strategic management with the daily management, tying up the long-term activities with the daily ones <ref name="e"> ''HOSHIN KANRI: POLICY MANAGEMENT IN JAPANESE-OWNED UK SUBSIDIARIES, Barry J. Witcher and Rosemary Butterworth, Journal of Management Studies 38:5 July 2001, University of East Anglia.''</ref>. | ||
The words HOSHIN KANRI can be divided into four sub words: | The words HOSHIN KANRI can be divided into four sub words: | ||
<ol> | <ol> | ||
| − | <li> Ho - means Direction | + | <li> Ho - means Direction; |
| − | <li> Shin - refers to Focus | + | <li> Shin - refers to Focus; |
| − | <li> Kan - refers to Alignment | + | <li> Kan - refers to Alignment; |
| − | <li> Ri - means Reason | + | <li> Ri - means Reason. |
</ol> | </ol> | ||
| − | + | Hence, the Japanese term Kanri means ''management'' and hoshin is translated as ''direction, shining needle'' or considered together as ''compass''. From this translation, Hoshin Kanri is seen as a compass that assists employees to be focused towards the Vision and Aims of an organization in order to continuously improve its processes <ref name="f"> ''Hoshin Kanri, The Strategic Approach to Continuous Improvement,David Hutchins.''</ref>. Promoting the involvement and alignment of all the employees, this method intents to build a strong connection between the daily activities performed at the operational levels with the business goals set at the strategic level, in order to achieve higher performance in all of the organization's business objectives <ref name="g"> ''Using Hoshin Kanri to improve the Value stream, Elizabeth A. Cudney, 2009 by Taylor & Francis Group, LLC.''</ref>. Furthermore, the process of Hoshin Kanri is endless, being applied as a strategic improvement cycle repeated each year. | |
| − | + | ||
| − | Hence, the Japanese term Kanri means ''management'' and hoshin is translated as ''direction, shining needle'' or considered together as ''compass''. From this translation, Hoshin Kanri is seen as a compass that assists employees to be focused towards the Vision and Aims of an organization in order to continuously improve its processes <ref name="f"> ''Hoshin Kanri, The Strategic Approach to Continuous Improvement,David Hutchins.''</ref>. Promoting the involvement and alignment of all the employees, this method intents to build a strong connection between the daily activities performed at the operational levels with the business goals set at the strategic level, in order to achieve higher performance in all of the organization's business objectives <ref name="g"> ''Using Hoshin Kanri to improve the Value stream, Elizabeth A. Cudney, 2009 by Taylor & Francis Group, LLC.''</ref> | + | |
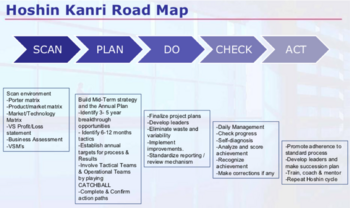
Hoshin Kanri is based on the PDCA cycle and can be broken down into 7 steps: | Hoshin Kanri is based on the PDCA cycle and can be broken down into 7 steps: | ||
<ol> | <ol> | ||
| − | <li> Establish the Vision and Mission of the organization | + | <li> Establish the Vision and Mission of the organization; |
| − | <li> Develop a long-term strategic plan (3-5 years) | + | <li> Develop a long-term strategic plan (3-5 years); |
| − | <li> Develop the annual objectives | + | <li> Develop the annual objectives; |
| − | <li> Define the projects | + | <li> Define the projects; |
| − | <li> Implement the projects | + | <li> Implement the projects; |
| − | <li> Check the organization's progress (every month or four months) | + | <li> Check the organization's progress (every month or four months); |
| − | <li> Annual review of the projects | + | <li> Annual review of the projects; |
</ol> | </ol> | ||
| Line 42: | Line 42: | ||
*'''The Porter's 5 forces analysis:''' the external environment is analyzed by looking at the five most potential threats <ref name="h"> ''Essentials of Contemporary Management Sixth Edition, Gareth R. Jones, Jennifer M. George, Rice University.''</ref>: | *'''The Porter's 5 forces analysis:''' the external environment is analyzed by looking at the five most potential threats <ref name="h"> ''Essentials of Contemporary Management Sixth Edition, Gareth R. Jones, Jennifer M. George, Rice University.''</ref>: | ||
| − | - ''The power of larger customers'' (at the bottom of the supply chain): bargaining power of customer | + | - ''The power of larger customers'' (at the bottom of the supply chain): bargaining power of customer; |
| − | - ''The power of larger suppliers'' (at the top of the supply chain): bargaining power of supplier | + | - ''The power of larger suppliers'' (at the top of the supply chain): bargaining power of supplier; |
| − | - ''The level of rivalry among organizations in an industry'': Industry rivalry | + | - ''The level of rivalry among organizations in an industry'': Industry rivalry; |
| − | - ''The threats of substitute products'' | + | - ''The threats of substitute products''; |
| − | - ''The potential to entry in a new industry'' | + | - ''The potential to entry in a new industry''. |
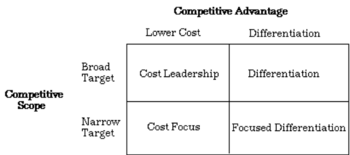
| − | *'''The Porter's generic strategies:''' to create a competitive advantage and reducing the threats of the five industry forces, managers have to choose between two ways of increasing the value of an organization's product <ref name="h"> ''Essentials of Contemporary Management Sixth Edition, Gareth R. Jones, Jennifer M. George, Rice University.''</ref>: ''differentiating the product'' to increase its value to customers or ''lowering the costs'' of making the product. Further, Porter discusses that managers have to give focus to the market as a whole (Broad Target) or in a specific segment (Narrow Target). Hence, managers are provided with four choices: | + | *'''The Porter's generic strategies:''' to create a competitive advantage and reducing the threats of the five industry forces, managers have to choose between two ways of increasing the value of an organization's product <ref name="h"> ''Essentials of Contemporary Management Sixth Edition, Gareth R. Jones, Jennifer M. George, Rice University.''</ref>: ''differentiating the product'' to increase its value to customers or ''lowering the costs'' of making the product. Further, Porter discusses that managers have to give focus to the market as a whole (Broad Target) or in a specific segment (Narrow Target). Hence, managers are provided with four choices (see the Figure 2): |
| − | [[File:comp.png|thumb|left|350px| Figure 2: Porter's matrix of generic strategies]] | + | [[File:comp.png|thumb|left|350px| Figure 2: Porter's matrix of generic strategies <ref name="r"> ''Roberto Panizzolo, Università degli studi di Padova, Gestione snella dei processi, 4 October 2017.''</ref>.]] |
| Line 68: | Line 68: | ||
| − | |||
| + | |||
| + | |||
| + | |||
| + | Cost and Differentiation have to be balanced. | ||
'''''Analysis of the internal environment:''''' | '''''Analysis of the internal environment:''''' | ||
The analysis of the internal environment is about understanding the available resources of the company in order to develop a competitive strategy. The Business Model Canvas, Blue Ocean strategy, SWOT analysis, Balanced Scorecard, Product/Market matrix and Importance/Performance matrix are assisting tools that can be utilized in order to analyze the internal environment. | The analysis of the internal environment is about understanding the available resources of the company in order to develop a competitive strategy. The Business Model Canvas, Blue Ocean strategy, SWOT analysis, Balanced Scorecard, Product/Market matrix and Importance/Performance matrix are assisting tools that can be utilized in order to analyze the internal environment. | ||
| − | *'''Blue Ocean:''' developed by Kim and Mauborgne, is a potent method for questioning Value Propositions and business models and exploring new Customer Segments. It develops two Oceans: the Blue, which is about creating a new innovative business value without threats and the Red, which considers all the threats (competitors). | + | *'''Blue Ocean:''' developed by Kim and Mauborgne, is a potent method for questioning Value Propositions and business models and exploring new Customer Segments. It develops two Oceans: the Blue, which is about creating a new innovative business value without threats and the Red, which considers all the threats (competitors) <ref name="s"> ''Business Model Generation,Alexander Osterwalder and Yves Pigneur,Published by John Wiley & Sons, Inc., Hoboken, New Jersey.''</ref>. |
| − | *'''Business Model Canvas:''' The Business Model Canvas complements Blue Ocean by providing a visual "big picture", through nine building blocks, which helps us understand how changing one part of a business model impacts the other components. | + | *'''Business Model Canvas:''' The Business Model Canvas complements Blue Ocean by providing a visual "big picture", through nine building blocks, which helps us understand how changing one part of a business model impacts the other components <ref name="h"> ''Essentials of Contemporary Management Sixth Edition, Gareth R. Jones, Jennifer M. George, Rice University.''</ref>. |
| − | *'''SWOT analysis:''' Is a powerful tool to identify possible external threats and opportunities and internal weaknesses and strengths of an organization. | + | *'''SWOT analysis:''' Is a powerful tool to identify possible external threats and opportunities and internal weaknesses and strengths of an organization <ref name="h"> ''Essentials of Contemporary Management Sixth Edition, Gareth R. Jones, Jennifer M. George, Rice University.''</ref>. |
| − | *'''Balanced Scorecard:''' It is a strategic tool based on four core areas: Financial, Customer, Internal business processes and Learning and Growth. | + | *'''Balanced Scorecard:''' It is a strategic tool based on four core areas: Financial, Customer, Internal business processes and Learning and Growth <ref name="p"> ''Peter Jacobsen, 42371 Design of Lean Production and Service Systems, Denmark Technical University, 16 February 2018 .''</ref>. |
| − | *'''Product/Market matrix:''' also referred to as Ansoff matrix, is a tool that provides information about the risk of growth/expansion in other markets. | + | *'''Product/Market matrix:''' also referred to as Ansoff matrix, is a tool that provides information about the risk of growth/expansion in other markets <ref name="r"> ''Roberto Panizzolo, Università degli studi di Padova, Gestione snella dei processi, 4 October 2017.''</ref>. |
*'''Importance/Performance matrix:''' also called the Slack matrix, is a tool that ranks a list of competitive factors (i.e. quality, costs...) and their performance in order to define the real importance of each factor to define a set of strategic operations <ref name="j"> ''The Importance-Performance Matrix as a Determinant of Improvement Priority,Nigel Slack,Warwick Business School, UK.''</ref>. | *'''Importance/Performance matrix:''' also called the Slack matrix, is a tool that ranks a list of competitive factors (i.e. quality, costs...) and their performance in order to define the real importance of each factor to define a set of strategic operations <ref name="j"> ''The Importance-Performance Matrix as a Determinant of Improvement Priority,Nigel Slack,Warwick Business School, UK.''</ref>. | ||
| Line 84: | Line 87: | ||
Toyota was the first company utilizing the A3 to develop the X-matrix. The A3, which name stems from the paper format (approximately 11x17 inches), is a status report that helps managers to gather information into a visual form facilitating the comprehension when communicated with others and hence applying efficiently in the PDCA activities <ref name="c"> ''Hoshin Kanri for the Lean Enterprise: Developing Competitive Capabilities and Managing Profit,Thomas L. Jackson.''</ref> <ref name="i"> ''Hoshin Kanri for Improved Environmental Performance, Conrad Soltero, 2007 Wiley Periodicals, Inc.''</ref> . | Toyota was the first company utilizing the A3 to develop the X-matrix. The A3, which name stems from the paper format (approximately 11x17 inches), is a status report that helps managers to gather information into a visual form facilitating the comprehension when communicated with others and hence applying efficiently in the PDCA activities <ref name="c"> ''Hoshin Kanri for the Lean Enterprise: Developing Competitive Capabilities and Managing Profit,Thomas L. Jackson.''</ref> <ref name="i"> ''Hoshin Kanri for Improved Environmental Performance, Conrad Soltero, 2007 Wiley Periodicals, Inc.''</ref> . | ||
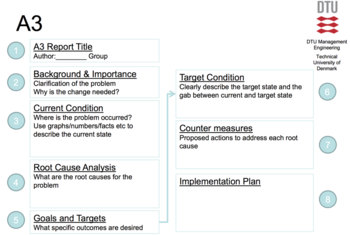
| − | An A3 is developed around 8 key points: | + | An A3 is developed around 8 key points (see Figure 3): |
| − | [[File:A3.png|thumb|left|350px| Figure | + | [[File:A3.png|thumb|left|350px| Figure 3: The 8 key points of an A3 <ref name="p"> ''Peter Jacobsen, 42371 Design of Lean Production and Service Systems, Denmark Technical University, 16 February 2018 .''</ref>.]] |
| + | |||
| + | |||
| Line 112: | Line 117: | ||
In the Hoshin Kanri six A3 points are described in order to handle the process. | In the Hoshin Kanri six A3 points are described in order to handle the process. | ||
| − | == A3-i: Competitive | + | === A3-i: Competitive Information Report === |
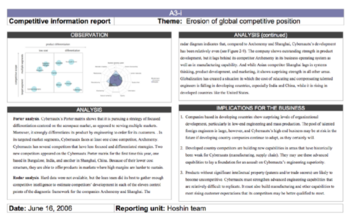
The result of Scanning process (needed to define the long-term goals) is represented by | The result of Scanning process (needed to define the long-term goals) is represented by | ||
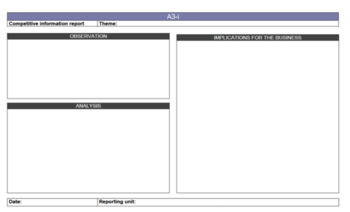
| − | the A3-i (intelligent report), which are | + | the A3-i (intelligent report), which are "used to build consensus about changes in the conditions of demand and supply before building the A3-X" <ref name="c"> ''Hoshin Kanri for the Lean Enterprise: Developing Competitive Capabilities and Managing Profit,Thomas L. Jackson.''</ref>. The aim of the A3-i is to gather all the information that managers have and then later, share it. |
''Supply conditions:'' change in price of materials, advances in technology, innovations in management methods, new products introduced in the competing market that may require action to develop new capabilities. | ''Supply conditions:'' change in price of materials, advances in technology, innovations in management methods, new products introduced in the competing market that may require action to develop new capabilities. | ||
| − | + | ||
''Demand conditions:'' change in the willingness of customers to buy the company products or services. | ''Demand conditions:'' change in the willingness of customers to buy the company products or services. | ||
| + | [[File:A3-i.png|thumb|left|350px| Figure 4: Structure of an A3-i <ref name="r"> ''Roberto Panizzolo, Università degli studi di Padova, Gestione snella dei processi, 4 October 2017.''</ref>.]] | ||
| + | |||
| + | |||
| + | |||
| + | |||
| + | |||
| + | |||
| + | |||
| + | |||
| + | |||
| + | |||
| + | |||
| + | |||
| + | |||
| + | |||
| + | |||
| + | |||
| + | |||
| + | |||
| + | |||
| + | |||
| + | |||
| + | |||
| Line 128: | Line 156: | ||
''Implications for the business:'' In this area, the specific implications are shown due to the change of the demand and supply. Therefore, it is required to explain which changes in the market, which may make an impact on the demand of products and services in the long-term and short-term period. | ''Implications for the business:'' In this area, the specific implications are shown due to the change of the demand and supply. Therefore, it is required to explain which changes in the market, which may make an impact on the demand of products and services in the long-term and short-term period. | ||
| + | [[File:A3iex.png|thumb|left|350px| Figure 5: Example of an A3-i <ref name="c"> ''Hoshin Kanri for the Lean Enterprise: Developing Competitive Capabilities and Managing Profit,Thomas L. Jackson.''</ref>.]] | ||
| − | |||
| − | == A3-X: The X-Matrix == | + | |
| + | |||
| + | |||
| + | |||
| + | |||
| + | |||
| + | |||
| + | |||
| + | |||
| + | |||
| + | |||
| + | |||
| + | |||
| + | |||
| + | |||
| + | |||
| + | |||
| + | |||
| + | |||
| + | |||
| + | |||
| + | |||
| + | === A3-X: The X-Matrix === | ||
The A3-X represent the X-Matrix, described as the implementation part of the Hoshin Kanri. | The A3-X represent the X-Matrix, described as the implementation part of the Hoshin Kanri. | ||
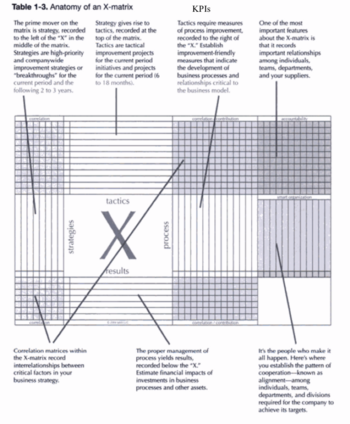
The X-Matrix supports the planning process of the Hoshin Kanri model in which the mid-term | The X-Matrix supports the planning process of the Hoshin Kanri model in which the mid-term | ||
| Line 139: | Line 189: | ||
(i.e. KPIs) in order to continuously improve all the organization's processes throughout the PDCA | (i.e. KPIs) in order to continuously improve all the organization's processes throughout the PDCA | ||
cycle. | cycle. | ||
| + | [[File:xma.png|thumb|left|350px| Figure 6: Structure of the X-Matrix <ref name="c"> ''Hoshin Kanri for the Lean Enterprise: Developing Competitive Capabilities and Managing Profit,Thomas L. Jackson.''</ref>.]] | ||
| + | |||
| + | |||
| + | |||
| + | |||
| + | |||
| + | |||
| + | |||
| + | |||
| + | |||
| + | |||
| + | |||
| + | |||
| + | |||
| + | |||
| + | |||
| + | |||
| + | |||
| + | |||
| + | |||
| + | |||
| + | |||
| + | |||
| + | |||
| + | |||
| + | |||
| + | |||
| + | |||
| + | |||
| + | |||
| + | |||
| + | |||
| + | |||
| + | |||
| + | |||
| + | |||
| + | |||
| + | |||
| + | |||
| + | |||
| − | |||
It all begins with the Strategies (on the left side of the matrix), previously defined in the | It all begins with the Strategies (on the left side of the matrix), previously defined in the | ||
| Line 148: | Line 237: | ||
Finally, results are reported in the bottom side of the matrix. | Finally, results are reported in the bottom side of the matrix. | ||
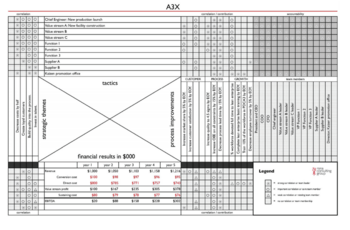
The four main aspects of the X-matrix (strategies, tactics, process and results) are linked two per | The four main aspects of the X-matrix (strategies, tactics, process and results) are linked two per | ||
| − | two using the symbols in the Legend box, hence analyzing the level of correlation/contribution | + | two using the symbols in the Legend box (see Figure 7), hence analyzing the level of correlation/contribution |
between the two. | between the two. | ||
| + | [[File:exxmatrix.png|thumb|left|350px| Figure 7: Example of the X-Matrix used by Rona Consulting Group <ref name="s"> ''Rona Consulting Group, Hoshin Kanri Brochure 2014 .''</ref>.]] | ||
| − | |||
| − | == A3-T == | + | |
| + | |||
| + | |||
| + | |||
| + | |||
| + | |||
| + | |||
| + | |||
| + | |||
| + | |||
| + | |||
| + | |||
| + | |||
| + | |||
| + | |||
| + | |||
| + | |||
| + | |||
| + | |||
| + | |||
| + | |||
| + | |||
| + | |||
| + | |||
| + | |||
| + | === A3-T: The Team Charter === | ||
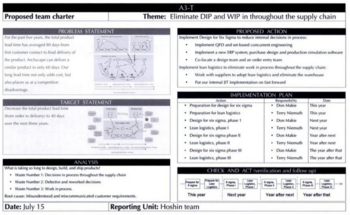
The A3-Ts supports the planning process of the Hoshin Kanri, appearing as "tactics" in the X-matrix because they are the mid-term proposals about how to achieve the long-term strategies (A3-i) using the PDCA cycle. | The A3-Ts supports the planning process of the Hoshin Kanri, appearing as "tactics" in the X-matrix because they are the mid-term proposals about how to achieve the long-term strategies (A3-i) using the PDCA cycle. | ||
| + | [[File:A3T.png|thumb|left|350px| Figure 8: Structure of an A3-T <ref name="c"> ''Hoshin Kanri for the Lean Enterprise: Developing Competitive Capabilities and Managing Profit,Thomas L. Jackson.''</ref>.]] | ||
| − | |||
| − | == A3-SR: The Status Report == | + | |
| + | |||
| + | |||
| + | |||
| + | |||
| + | |||
| + | |||
| + | |||
| + | |||
| + | |||
| + | |||
| + | |||
| + | |||
| + | |||
| + | |||
| + | |||
| + | |||
| + | |||
| + | |||
| + | |||
| + | |||
| + | |||
| + | === A3-SR: The Status Report === | ||
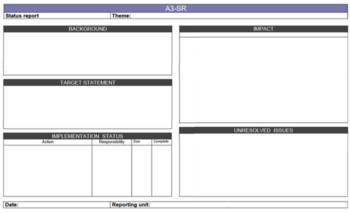
Being the A3-SR or Status report A3 part of the checking process of the Hoshin Kanri, its aim is to report monthly to managers regarding the progress made on an individual project, set in an A3-T or an A3-P, listing all the difficulties encountered and how to solve them. | Being the A3-SR or Status report A3 part of the checking process of the Hoshin Kanri, its aim is to report monthly to managers regarding the progress made on an individual project, set in an A3-T or an A3-P, listing all the difficulties encountered and how to solve them. | ||
| + | [[File:A3SR.png|thumb|left|350px| Figure 9: Structure of an A3-SR <ref name="r"> ''Roberto Panizzolo, Università degli studi di Padova, Gestione snella dei processi, 4 October 2017.''</ref>.]] | ||
| − | |||
| − | == A3-SSR: The Summary Status Report == | + | |
| + | |||
| + | |||
| + | |||
| + | |||
| + | |||
| + | |||
| + | |||
| + | |||
| + | |||
| + | |||
| + | |||
| + | |||
| + | |||
| + | |||
| + | |||
| + | |||
| + | |||
| + | |||
| + | |||
| + | |||
| + | |||
| + | === A3-SSR: The Summary Status Report === | ||
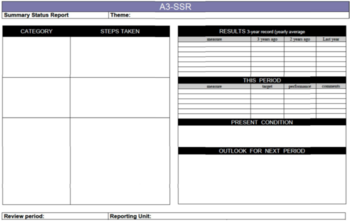
The A3-SSR is a summary report for managers done less frequently than the A3-SR report, | The A3-SSR is a summary report for managers done less frequently than the A3-SR report, | ||
in which are given information regarding the status of multiple hoshin projects defined as tactics in the A3-X. The summary status report is part of the checking process of the Hoshin Kanri. | in which are given information regarding the status of multiple hoshin projects defined as tactics in the A3-X. The summary status report is part of the checking process of the Hoshin Kanri. | ||
| + | [[File:A3SSR.png|thumb|left|350px| Figure 10: Structure of an A3-SSR <ref name="r"> ''Roberto Panizzolo, Università degli studi di Padova, Gestione snella dei processi, 4 October 2017.''</ref>.]] | ||
| − | |||
| − | == A3-P: The Problem Report == | + | |
| + | |||
| + | |||
| + | |||
| + | |||
| + | |||
| + | |||
| + | |||
| + | |||
| + | |||
| + | |||
| + | |||
| + | |||
| + | |||
| + | |||
| + | |||
| + | |||
| + | |||
| + | |||
| + | |||
| + | |||
| + | |||
| + | === A3-P: The Problem Report === | ||
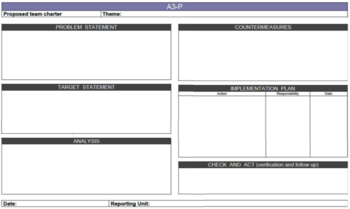
The A3-P or problem report highlights a problem not predicted in the annual hoshin that the team-work is not able to solve. This belongs to the checking process of the Hoshin Kanri. | The A3-P or problem report highlights a problem not predicted in the annual hoshin that the team-work is not able to solve. This belongs to the checking process of the Hoshin Kanri. | ||
| + | [[File:A3P.png|thumb|left|350px| Figure 11: Structure of an A3-P <ref name="r"> ''Roberto Panizzolo, Università degli studi di Padova, Gestione snella dei processi, 4 October 2017.''</ref>.]] | ||
| + | |||
| + | |||
| + | |||
| + | |||
| + | |||
| + | |||
| + | |||
| + | |||
| + | |||
| + | |||
| + | |||
| + | |||
| + | |||
| + | |||
| + | |||
| + | |||
| + | |||
| + | |||
| − | |||
| Line 179: | Line 377: | ||
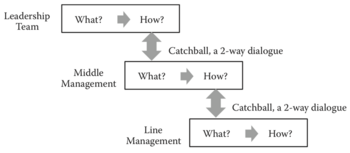
The Catchball or deployment process represents the core of the Hoshin Kanri. It is both a top-down and a bottom-up communication process that aims to coordinate the objectives to the lowest levels of the organization and across the functional departments <ref name="k"> ''THE BASICS OF HOSHIN KANRI,Randy K. Kesterson, 2015 by Taylor & Francis Group, LLC.''</ref>. | The Catchball or deployment process represents the core of the Hoshin Kanri. It is both a top-down and a bottom-up communication process that aims to coordinate the objectives to the lowest levels of the organization and across the functional departments <ref name="k"> ''THE BASICS OF HOSHIN KANRI,Randy K. Kesterson, 2015 by Taylor & Francis Group, LLC.''</ref>. | ||
Being an interactive process that goes back and forth through the organization hierarchy, it empowers not only the managers but also the subordinates to toss ideas in order to help mangers achieve organizational goals, enhancing a higher level of understanding combined with a higher level of commitment in order to achieve the organizational goals <ref name="l"> ''Hoshin Kanri: Implementing the Catchball Process,Charles Tennant and Paul Roberts,School of Engineering, University of Warwick.''</ref>. | Being an interactive process that goes back and forth through the organization hierarchy, it empowers not only the managers but also the subordinates to toss ideas in order to help mangers achieve organizational goals, enhancing a higher level of understanding combined with a higher level of commitment in order to achieve the organizational goals <ref name="l"> ''Hoshin Kanri: Implementing the Catchball Process,Charles Tennant and Paul Roberts,School of Engineering, University of Warwick.''</ref>. | ||
| + | [[File:catchball.png|thumb|left|350px| Figure 12: Catchball communication process <ref name="k"> ''THE BASICS OF HOSHIN KANRI,Randy K. Kesterson, 2015 by Taylor & Francis Group, LLC.''</ref>.]] | ||
| + | |||
| + | |||
| + | |||
| + | |||
| + | |||
| + | |||
| + | |||
| + | |||
| + | |||
| + | |||
| + | |||
| + | |||
| + | |||
| + | |||
| + | |||
| + | |||
| − | |||
== The PDCA Cycle== | == The PDCA Cycle== | ||
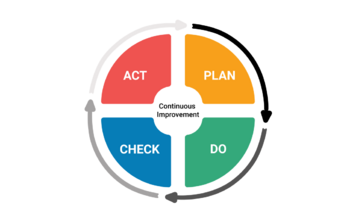
| Line 188: | Line 402: | ||
The four steps are: | The four steps are: | ||
<ol> | <ol> | ||
| − | <li> ''Plan:'' establishing objectives and process to achieve specific results | + | <li> ''Plan:'' establishing objectives and process to achieve specific results; |
| − | <li> ''Do:'' implementing the processes | + | <li> ''Do:'' implementing the processes; |
| − | <li> ''Check:'' the processes are monitored and assessed against the specifications | + | <li> ''Check:'' the processes are monitored and assessed against the specifications; |
<li> ''Act:'' in order to meet the specifications actions are taken. | <li> ''Act:'' in order to meet the specifications actions are taken. | ||
</ol> | </ol> | ||
| + | |||
| + | [[File:rm.png|thumb|left|350px| Figure 13: Example of Hoshin Kanri Road Map applied by BMGI India <ref name="q"> ''Hoshin KanriBMGI India71B Mittal Court Nariman PointMumbai: Aligning Operational Goals to Strategic Goals.''</ref>. ]] | ||
| + | |||
| + | |||
| + | |||
| + | |||
| + | |||
| + | |||
| + | |||
| + | |||
| + | |||
| + | |||
| + | |||
| + | |||
| + | |||
| + | |||
| + | |||
| + | |||
| + | |||
| + | |||
| + | |||
| + | |||
| + | |||
| − | |||
== Benefits: Hoshin Kanri, a tool that makes the difference == | == Benefits: Hoshin Kanri, a tool that makes the difference == | ||
| Line 205: | Line 441: | ||
The main difference between a company and a company utilizing the Hoshin Kanri, is that it can be seen in how the PDCA cycle is applied, therefore in how portfolio objectives impact daily operations. In specific, from the picture below, the left side shows how | The main difference between a company and a company utilizing the Hoshin Kanri, is that it can be seen in how the PDCA cycle is applied, therefore in how portfolio objectives impact daily operations. In specific, from the picture below, the left side shows how | ||
| − | + | [[File:pdca.png|thumb|left|350px| Figure 14: From a "normal" PDCA cycle to its evolution in a Hoshin Kanri application <ref name="c"> ''Hoshin Kanri for the Lean Enterprise: Developing Competitive Capabilities and Managing Profit,Thomas L. Jackson.''</ref>.]] | |
| − | + | ||
| + | |||
| + | |||
| + | |||
| + | |||
| + | |||
| + | |||
| + | |||
| + | |||
| + | |||
| + | |||
| + | |||
| + | |||
| + | |||
| + | |||
| + | |||
"normal" organizations use the PDCA cycle: top managers deploy strategies without engaging lower level managers and the hourly workforce. Being told only what they have to do, the consequence is a reduced understanding of the objectives that cause a poor success in the Do stage of the PDCA cycle <ref name="c"> ''Hoshin Kanri for the Lean Enterprise: Developing Competitive Capabilities and Managing Profit,Thomas L. Jackson.''</ref>. Instead, on the right side of the picture, the effect of a lean organization using Hoshin Kanri is depicted. In this, there is a cogeneration of PDCA cycles: empowering employees with a deployment process, it allows them to gain the ability to change the strategic course of the planned activities because they can act based on new information (due to the top-down/bottom-up flow of information), resulting in changes in all the other cycles which translate to a continuous organizational improvement. | "normal" organizations use the PDCA cycle: top managers deploy strategies without engaging lower level managers and the hourly workforce. Being told only what they have to do, the consequence is a reduced understanding of the objectives that cause a poor success in the Do stage of the PDCA cycle <ref name="c"> ''Hoshin Kanri for the Lean Enterprise: Developing Competitive Capabilities and Managing Profit,Thomas L. Jackson.''</ref>. Instead, on the right side of the picture, the effect of a lean organization using Hoshin Kanri is depicted. In this, there is a cogeneration of PDCA cycles: empowering employees with a deployment process, it allows them to gain the ability to change the strategic course of the planned activities because they can act based on new information (due to the top-down/bottom-up flow of information), resulting in changes in all the other cycles which translate to a continuous organizational improvement. | ||
| Line 218: | Line 469: | ||
- It creates alignment and involvement towards the organizational objectives. | - It creates alignment and involvement towards the organizational objectives. | ||
| − | == Limitations: Western | + | == Limitations: Western Culture vs Hoshin Kanri == |
Hoshin Kanri is referred to by different names (as reported at the beginning of the text) giving space for possible misinterpretations of it. | Hoshin Kanri is referred to by different names (as reported at the beginning of the text) giving space for possible misinterpretations of it. | ||
The misinterpretation/misunderstanding is about the purpose of the Hoshin Kanri: for the Western companies it is seen only as a Lean tool to achieve a result; while for the Japanize companies, it is a leadership system in which the focus is based on how the breakthrough processes are done in order to achieve the organization goals (focus on quality, productivity and teamwork) <ref name="k"> ''THE BASICS OF HOSHIN KANRI,Randy K. Kesterson, 2015 by Taylor & Francis Group, LLC.''</ref>. The reason why there are two versions of the Hoshin Kanri is because the Japanese literature comes from local experiences in Japan (practitioners), instead the Western one is due to the consultancy know-how <ref name="e"> ''HOSHIN KANRI: POLICY MANAGEMENT IN JAPANESE-OWNED UK SUBSIDIARIES, Barry J. Witcher and Rosemary Butterworth, Journal of Management Studies 38:5 July 2001, University of East Anglia.''</ref>. | The misinterpretation/misunderstanding is about the purpose of the Hoshin Kanri: for the Western companies it is seen only as a Lean tool to achieve a result; while for the Japanize companies, it is a leadership system in which the focus is based on how the breakthrough processes are done in order to achieve the organization goals (focus on quality, productivity and teamwork) <ref name="k"> ''THE BASICS OF HOSHIN KANRI,Randy K. Kesterson, 2015 by Taylor & Francis Group, LLC.''</ref>. The reason why there are two versions of the Hoshin Kanri is because the Japanese literature comes from local experiences in Japan (practitioners), instead the Western one is due to the consultancy know-how <ref name="e"> ''HOSHIN KANRI: POLICY MANAGEMENT IN JAPANESE-OWNED UK SUBSIDIARIES, Barry J. Witcher and Rosemary Butterworth, Journal of Management Studies 38:5 July 2001, University of East Anglia.''</ref>. | ||
| Line 239: | Line 490: | ||
What is clear so far is the capacity of this strategic tool to link the long-term strategies with the daily ones, delivering through the Catchball, a clear scope: improvement of the processes in order to have better organization results. | What is clear so far is the capacity of this strategic tool to link the long-term strategies with the daily ones, delivering through the Catchball, a clear scope: improvement of the processes in order to have better organization results. | ||
A better performance can only be achieved when all the parts involved are committed to give their best, from the willingness of the top-managers to carry out a Catchball process, as well as from the workforce perspective to be committed to the daily tasks, supporting managers with feedbacks for the A3s as part of a continual improvement process. | A better performance can only be achieved when all the parts involved are committed to give their best, from the willingness of the top-managers to carry out a Catchball process, as well as from the workforce perspective to be committed to the daily tasks, supporting managers with feedbacks for the A3s as part of a continual improvement process. | ||
| + | |||
| + | == Key References == | ||
| + | '''Hoshin Kanri for the Lean Enterprise: Developing Competitive Capabilities and Managing Profit,Thomas L. Jackson''' This book is written by Thomas L. Jackson, a founding member of taktX, a lean management consultancy based in Portland,Oregon. The book is useful fo anyone who aims to have a deep understanding about what is Hoshin Kanri and how is applied in a lean organization. | ||
| + | |||
| + | '''Using Hoshin Kanri to improve the Value stream, Elizabeth A. Cudney, 2009 by Taylor & Francis Group, LLC''' In this book, Cudney describes chapter by chapter the crucial role of Hoshin Kanri to improve the delivery of value through all the organization until the final customers. This is explained in a case study with Carjo Manufacturing Co. | ||
| + | |||
| + | '''THE BASICS OF HOSHIN KANRI,Randy K. Kesterson''' The book uses a story format to simplify the explanation of the Hoshin Kanri, giving information about how this method can significantly improve the planning process in an organization. Next, the author reports the opinions of manufacturing executives that use this method to run their businesses. | ||
== References == | == References == | ||
<references /> | <references /> | ||
Latest revision as of 16:55, 16 November 2018
Developed by Davide Sartori
[edit] Abstract
The point of convergence for this article is to present and explain the "Hoshin Kanri" (or Policy Deployment) method, presented by Dr. Yoji Akao, a leading Japanese author, in Hoshin Kanri: Policy deployment for successful TQM (1991). Hoshin Kanri is defined as a "form of corporate-wide management that combines strategic management and operational management by linking the achievement of top management goals with daily management at an operation level [1]. This method is an essential support for TQM [2] and is based on the PDCA cycle. Hence, at the strategic level, the method can be applied by scanning the context of the company in order to further understand how to position in the market. To do that, the external and the internal environments need to be studied utilizing the Porter's 5 forces analysis and the Porter's generic strategies (for the external environment). On the other hand, for the internal environment, which is about understanding the available resources of the company in order to develop a competitive strategy, a Business Model Canvas, a Product/Market matrix, a Importance/Performance matrix, a SWOT analysis or a Balanced Scorecard is more applicable. Subsequently, during the planning step, the long and mid-short term goals are decided and through the X-Matrix, which is the way of implementing the Hoshin Kanri, the operational and organizational goals are aligned. After the implementation, the progress has to be continuously monitored, keeping track of all the activities and improving them. Furthermore, the article will give attention to the Catchball process, which is a necessary communication process aiming to obtain successful implementation of the Hoshin Kanri throughout all of the company levels.
[edit] Different names of Hoshin Kanri
Yoji Akao, was the first Japanese author in 1991 writing an authoritative text about the implementation of the Hoshin Kanri [3]. The approach was first utilized in Japan in the 1950 and 1960s, after the Second World War, because the local companies were facing difficulties to regain competitiveness. Many years later, in the 1980s, it was introduced to the Western audience, then named "Policy Deployment" by western writers [4]. Interestingly, the method is still referred to by various names, also within companies (for instance at AT&T and Texas Instruments, it is called "Policy Deployment"; at Hewlett-Packard and Proctor & Gamble, it is labeled "Hoshin planning"; in the Xerox Corporation it is called "Managing for Results" and at Unilever it is called "Management into Action" [1]).Also many writers refer to it differently, this leaves space for the term to be interpreted and used improperly [4].
[edit] The Hoshin Kanri
Hoshin Kanri, or Policy Deployment, is a strategic planning tool used to manage complex portfolio management processes in lean enterprises. It combines the strategic management with the daily management, tying up the long-term activities with the daily ones [6]. The words HOSHIN KANRI can be divided into four sub words:
- Ho - means Direction;
- Shin - refers to Focus;
- Kan - refers to Alignment;
- Ri - means Reason.
Hence, the Japanese term Kanri means management and hoshin is translated as direction, shining needle or considered together as compass. From this translation, Hoshin Kanri is seen as a compass that assists employees to be focused towards the Vision and Aims of an organization in order to continuously improve its processes [7]. Promoting the involvement and alignment of all the employees, this method intents to build a strong connection between the daily activities performed at the operational levels with the business goals set at the strategic level, in order to achieve higher performance in all of the organization's business objectives [8]. Furthermore, the process of Hoshin Kanri is endless, being applied as a strategic improvement cycle repeated each year.
Hoshin Kanri is based on the PDCA cycle and can be broken down into 7 steps:
- Establish the Vision and Mission of the organization;
- Develop a long-term strategic plan (3-5 years);
- Develop the annual objectives;
- Define the projects;
- Implement the projects;
- Check the organization's progress (every month or four months);
- Annual review of the projects;
[edit] Competitive Strategy: Scanning process
The development of the long-term strategy of an organization is part of the scanning process. In this step, top-managers aim to understand where to position the business in the market analyzing two fundamental aspects: the external and the internal environment.
Analysis of the external environment:
This can be done making use of two models by Michael Porter:
- The Porter's 5 forces analysis: the external environment is analyzed by looking at the five most potential threats [9]:
- The power of larger customers (at the bottom of the supply chain): bargaining power of customer;
- The power of larger suppliers (at the top of the supply chain): bargaining power of supplier;
- The level of rivalry among organizations in an industry: Industry rivalry;
- The threats of substitute products;
- The potential to entry in a new industry.
- The Porter's generic strategies: to create a competitive advantage and reducing the threats of the five industry forces, managers have to choose between two ways of increasing the value of an organization's product [9]: differentiating the product to increase its value to customers or lowering the costs of making the product. Further, Porter discusses that managers have to give focus to the market as a whole (Broad Target) or in a specific segment (Narrow Target). Hence, managers are provided with four choices (see the Figure 2):
Cost and Differentiation have to be balanced.
Analysis of the internal environment: The analysis of the internal environment is about understanding the available resources of the company in order to develop a competitive strategy. The Business Model Canvas, Blue Ocean strategy, SWOT analysis, Balanced Scorecard, Product/Market matrix and Importance/Performance matrix are assisting tools that can be utilized in order to analyze the internal environment.
- Blue Ocean: developed by Kim and Mauborgne, is a potent method for questioning Value Propositions and business models and exploring new Customer Segments. It develops two Oceans: the Blue, which is about creating a new innovative business value without threats and the Red, which considers all the threats (competitors) [10].
- Business Model Canvas: The Business Model Canvas complements Blue Ocean by providing a visual "big picture", through nine building blocks, which helps us understand how changing one part of a business model impacts the other components [9].
- SWOT analysis: Is a powerful tool to identify possible external threats and opportunities and internal weaknesses and strengths of an organization [9].
- Balanced Scorecard: It is a strategic tool based on four core areas: Financial, Customer, Internal business processes and Learning and Growth [11].
- Product/Market matrix: also referred to as Ansoff matrix, is a tool that provides information about the risk of growth/expansion in other markets [5].
- Importance/Performance matrix: also called the Slack matrix, is a tool that ranks a list of competitive factors (i.e. quality, costs...) and their performance in order to define the real importance of each factor to define a set of strategic operations [12].
[edit] From the A3s to the X-Matrix
Toyota was the first company utilizing the A3 to develop the X-matrix. The A3, which name stems from the paper format (approximately 11x17 inches), is a status report that helps managers to gather information into a visual form facilitating the comprehension when communicated with others and hence applying efficiently in the PDCA activities [3] [13] . An A3 is developed around 8 key points (see Figure 3):
In the Hoshin Kanri six A3 points are described in order to handle the process.
[edit] A3-i: Competitive Information Report
The result of Scanning process (needed to define the long-term goals) is represented by the A3-i (intelligent report), which are "used to build consensus about changes in the conditions of demand and supply before building the A3-X" [3]. The aim of the A3-i is to gather all the information that managers have and then later, share it.
Supply conditions: change in price of materials, advances in technology, innovations in management methods, new products introduced in the competing market that may require action to develop new capabilities.
Demand conditions: change in the willingness of customers to buy the company products or services.
Observation: In this space it is asked to report all the changes about demand and supply that might influence the strategy, thus modifying it.
Analysis: In this area, the observations are explained via the tools used in the external and internal environment.
Implications for the business: In this area, the specific implications are shown due to the change of the demand and supply. Therefore, it is required to explain which changes in the market, which may make an impact on the demand of products and services in the long-term and short-term period.
[edit] A3-X: The X-Matrix
The A3-X represent the X-Matrix, described as the implementation part of the Hoshin Kanri. The X-Matrix supports the planning process of the Hoshin Kanri model in which the mid-term strategies are set (A3-T) and deployed through all the organizations. It is useful to align the organizational structure with its strategic goals, helping top-managers in the difficult process of prioritizing objectives and monitor the organization's performance via different indicators (i.e. KPIs) in order to continuously improve all the organization's processes throughout the PDCA cycle.
It all begins with the Strategies (on the left side of the matrix), previously defined in the A3-i. For each of them, tactics are set (top side of the matrix), explaining how to pursue the strategies during a period of 6-18 months. The tactics are analyzed by indicators and some employees are responsible to keep them on track (right side of the matrix). Finally, results are reported in the bottom side of the matrix. The four main aspects of the X-matrix (strategies, tactics, process and results) are linked two per two using the symbols in the Legend box (see Figure 7), hence analyzing the level of correlation/contribution between the two.
[edit] A3-T: The Team Charter
The A3-Ts supports the planning process of the Hoshin Kanri, appearing as "tactics" in the X-matrix because they are the mid-term proposals about how to achieve the long-term strategies (A3-i) using the PDCA cycle.
[edit] A3-SR: The Status Report
Being the A3-SR or Status report A3 part of the checking process of the Hoshin Kanri, its aim is to report monthly to managers regarding the progress made on an individual project, set in an A3-T or an A3-P, listing all the difficulties encountered and how to solve them.
[edit] A3-SSR: The Summary Status Report
The A3-SSR is a summary report for managers done less frequently than the A3-SR report, in which are given information regarding the status of multiple hoshin projects defined as tactics in the A3-X. The summary status report is part of the checking process of the Hoshin Kanri.
[edit] A3-P: The Problem Report
The A3-P or problem report highlights a problem not predicted in the annual hoshin that the team-work is not able to solve. This belongs to the checking process of the Hoshin Kanri.
[edit] The Catchball: The Deployment process
The Catchball or deployment process represents the core of the Hoshin Kanri. It is both a top-down and a bottom-up communication process that aims to coordinate the objectives to the lowest levels of the organization and across the functional departments [14]. Being an interactive process that goes back and forth through the organization hierarchy, it empowers not only the managers but also the subordinates to toss ideas in order to help mangers achieve organizational goals, enhancing a higher level of understanding combined with a higher level of commitment in order to achieve the organizational goals [15].
[edit] The PDCA Cycle
The PDCA cycle, developed by Walter Shewhart, is not only used to develop and deploy the organization strategies through all the levels of the company, but is also used as a problem solving-method in order to iron out problems that may arise during the needed processes, concluding into increasing the quality of them [8]. The PDCA cycle can be seen as an ongoing improvement process that never ends; that is due to its nature of being a problem-solving method [3].
The four steps are:
- Plan: establishing objectives and process to achieve specific results;
- Do: implementing the processes;
- Check: the processes are monitored and assessed against the specifications;
- Act: in order to meet the specifications actions are taken.
[edit] Benefits: Hoshin Kanri, a tool that makes the difference
According to the Project Management Institute, a Portfolio is "a collection of projects or programs and other work that are grouped together to facilitate effective management of that work to meet strategic objectives". Regarding the link between portfolio management and operations management it has been stated that "the achievement of portfolio objectives may impact functional groups within an organization in their daily operations" [17] .
The high effectiveness of the Hoshin Kanri, is due to the synergy between the deployment process, (called Catchball) and the PDCA cycle (applied to all the levels of the organization), and leaves no doubt about the coherence to apply this tool in a Portfolio management process, hence improving the linkage between strategic goals and daily operations. The anticipated result is a lean organization in which the corporate's strategies are well understood by the workforce as a whole, thus enhancing a better achievement of the organization's goals [3]. The companies making use of Hoshin Kanri typically move towards a concept of self-control manager, in which managers in all the departments and teams are empowered to self-monitor their performance targets within daily work, in order to achieve the objectives of the strategies [18].
The main difference between a company and a company utilizing the Hoshin Kanri, is that it can be seen in how the PDCA cycle is applied, therefore in how portfolio objectives impact daily operations. In specific, from the picture below, the left side shows how
"normal" organizations use the PDCA cycle: top managers deploy strategies without engaging lower level managers and the hourly workforce. Being told only what they have to do, the consequence is a reduced understanding of the objectives that cause a poor success in the Do stage of the PDCA cycle [3]. Instead, on the right side of the picture, the effect of a lean organization using Hoshin Kanri is depicted. In this, there is a cogeneration of PDCA cycles: empowering employees with a deployment process, it allows them to gain the ability to change the strategic course of the planned activities because they can act based on new information (due to the top-down/bottom-up flow of information), resulting in changes in all the other cycles which translate to a continuous organizational improvement.
The benefits of the Hoshin Kanri are briefly summarized here:
- It helps the planning process to be continuously improved;
- It empowers and integrates the workforce encouraging cross-functional cooperation to achieve breakthrough objectives;
- It creates alignment and involvement towards the organizational objectives.
[edit] Limitations: Western Culture vs Hoshin Kanri
Hoshin Kanri is referred to by different names (as reported at the beginning of the text) giving space for possible misinterpretations of it. The misinterpretation/misunderstanding is about the purpose of the Hoshin Kanri: for the Western companies it is seen only as a Lean tool to achieve a result; while for the Japanize companies, it is a leadership system in which the focus is based on how the breakthrough processes are done in order to achieve the organization goals (focus on quality, productivity and teamwork) [14]. The reason why there are two versions of the Hoshin Kanri is because the Japanese literature comes from local experiences in Japan (practitioners), instead the Western one is due to the consultancy know-how [6].
Another factor of the Hoshin Kanri that strives to be implemented in the right way is the Catchball process, or rather the fundamental step in which the deployment of the strategic objectives matches the daily operations gaining consensus from the workforce. This process finds great difficulties to be adopted in the Western companies as it is highly time consuming and requires complete involvement and commitment from top-managers to successfully implement it through the whole of the organization [15].
The limitations of the Hoshin Kanri are briefly summarized here:
- Culture barriers;
- It requires to be adopted as a lean system and not as a tool;
- It requires complete involvement and commitment from all the employees;
- The Catchball process is very time-consuming.
[edit] Conclusion
The concept's main purpose gives a project direction [19], this is the same as Hoshin Kanri is doing in a macroscale context. It is described as a compass that helps employees to focus towards a common goal, ensuring alignment and giving reason. This is highly correlated to the purpose perspective, since the purpose perspective serves as the guideline for a similar approach of focus, vision and alignment in a project process.
What is clear so far is the capacity of this strategic tool to link the long-term strategies with the daily ones, delivering through the Catchball, a clear scope: improvement of the processes in order to have better organization results. A better performance can only be achieved when all the parts involved are committed to give their best, from the willingness of the top-managers to carry out a Catchball process, as well as from the workforce perspective to be committed to the daily tasks, supporting managers with feedbacks for the A3s as part of a continual improvement process.
[edit] Key References
Hoshin Kanri for the Lean Enterprise: Developing Competitive Capabilities and Managing Profit,Thomas L. Jackson This book is written by Thomas L. Jackson, a founding member of taktX, a lean management consultancy based in Portland,Oregon. The book is useful fo anyone who aims to have a deep understanding about what is Hoshin Kanri and how is applied in a lean organization.
Using Hoshin Kanri to improve the Value stream, Elizabeth A. Cudney, 2009 by Taylor & Francis Group, LLC In this book, Cudney describes chapter by chapter the crucial role of Hoshin Kanri to improve the delivery of value through all the organization until the final customers. This is explained in a case study with Carjo Manufacturing Co.
THE BASICS OF HOSHIN KANRI,Randy K. Kesterson The book uses a story format to simplify the explanation of the Hoshin Kanri, giving information about how this method can significantly improve the planning process in an organization. Next, the author reports the opinions of manufacturing executives that use this method to run their businesses.
[edit] References
- ↑ 1.0 1.1 Policy management of strategy (hoshin kanri) ,Barry J. Witcher, School of Management, University of East Anglia, UK
- ↑ USING QFD TO DRIVE TQM IMPLEMENTATION,Dr. Robert A Hunt,Director Centre for Management Innovation and Technology Graduate School of Management, Macquarie University,Sydney, Australia 2109.
- ↑ 3.0 3.1 3.2 3.3 3.4 3.5 3.6 3.7 3.8 3.9 Hoshin Kanri for the Lean Enterprise: Developing Competitive Capabilities and Managing Profit,Thomas L. Jackson.
- ↑ 4.0 4.1 Policy deployment: an examination of the theory, R.G. Lee and B.G. Dale Manchester School of Management, UMIST, UK.
- ↑ 5.0 5.1 5.2 5.3 5.4 5.5 5.6 Roberto Panizzolo, Università degli studi di Padova, Gestione snella dei processi, 4 October 2017.
- ↑ 6.0 6.1 HOSHIN KANRI: POLICY MANAGEMENT IN JAPANESE-OWNED UK SUBSIDIARIES, Barry J. Witcher and Rosemary Butterworth, Journal of Management Studies 38:5 July 2001, University of East Anglia.
- ↑ Hoshin Kanri, The Strategic Approach to Continuous Improvement,David Hutchins.
- ↑ 8.0 8.1 Using Hoshin Kanri to improve the Value stream, Elizabeth A. Cudney, 2009 by Taylor & Francis Group, LLC.
- ↑ 9.0 9.1 9.2 9.3 Essentials of Contemporary Management Sixth Edition, Gareth R. Jones, Jennifer M. George, Rice University.
- ↑ 10.0 10.1 Business Model Generation,Alexander Osterwalder and Yves Pigneur,Published by John Wiley & Sons, Inc., Hoboken, New Jersey.
- ↑ 11.0 11.1 Peter Jacobsen, 42371 Design of Lean Production and Service Systems, Denmark Technical University, 16 February 2018 .
- ↑ The Importance-Performance Matrix as a Determinant of Improvement Priority,Nigel Slack,Warwick Business School, UK.
- ↑ Hoshin Kanri for Improved Environmental Performance, Conrad Soltero, 2007 Wiley Periodicals, Inc.
- ↑ 14.0 14.1 14.2 THE BASICS OF HOSHIN KANRI,Randy K. Kesterson, 2015 by Taylor & Francis Group, LLC.
- ↑ 15.0 15.1 Hoshin Kanri: Implementing the Catchball Process,Charles Tennant and Paul Roberts,School of Engineering, University of Warwick.
- ↑ Hoshin KanriBMGI India71B Mittal Court Nariman PointMumbai: Aligning Operational Goals to Strategic Goals.
- ↑ The Standard for Portfolio Management, Second Edition,Project Management Institute.
- ↑ Employee engagement and manager self-efficacy: Implications for managerial effectiveness and development, Fred Luthans Department of Management, University of Nebraska-Lincoln, Lincoln, Nebraska, USA, Suzanne J. Peterson,Department of Management,MiamiUniversity,RichardT.Farmer School of Business Administration, Oxford, Ohio, USA.
- ↑ Hoshin Kanri: Implementing the Catchball Process,Charles Tennant and Paul Roberts,School of Engineering, University of Warwick.