Example APPPM 2020
| (One intermediate revision by one user not shown) | |||
| Line 160: | Line 160: | ||
| + | |||
| + | |||
| + | '''Critical Path Method''' | ||
| + | The critical path method is a way to schedule a project work. Typically there are several activities conducted simultaneously within the project. These activities could have dependencies based on which paths are created. The time for each activity to be completed is identified and the longest path is found and deemed to be critical. The shortest time to complete the project is set by critical path, thus it is essential to have on time delivery of all activities bounded to critical path. Other paths might have floats or delays which will not cause any additional costs as long as the total path time won’t exceed the total critical path time.<ref>http://production.datastore.cvt.dk/filestore?oid=5a14723f5010df36af59f816&targetid=5a14723f5010df36af59f81a</ref> | ||
| + | |||
| + | |||
| + | |||
| + | '''Decision Tree''' | ||
| + | A decision tree is a tool which aids in decision making by forming a tree-like graph. The graph helps to visualize various decisions and their associated consequences, including the probability of a given event to happen, costs and resources. One can distinguish between three types of nodes while designing decision tree. These are decision nodes represented by squares, chance nodes represented by circles and end nodes represented by triangles. The most popular fields of applications for decision tree are operations research, operations management and machine learning. <ref>2008 Project Management Institute. A Guide to the Project Management Body of Knowledge (PMBOK® Guide) — Fourth Edition</ref> | ||
Latest revision as of 19:55, 7 March 2020
[edit] Collection of tools
Salience Model by PMI [1]
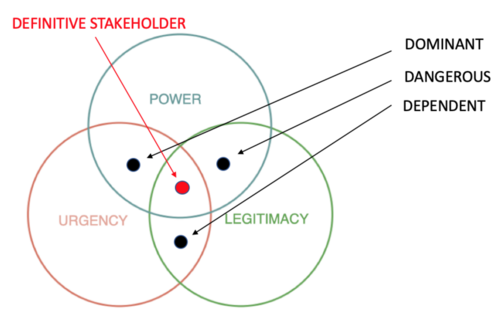
Salience Model is a tool used to classify relevant stakeholders, with the aim of monitoring stakeholder management. This classification is based on assessments of their power, urgency, and legitimacy. The Salience Model is useful for projects, programs or portfolios with a large complex number of stakeholders or if complex networks of relationships have to be monitored. It is also useful in determining the relative importance of the identified stakeholders.
Service Blueprinting [3]
A service blueprint is a diagram that displays the entire process of service delivery, by listing all the activities that happen at each stage, performed by the different roles involved. The service blueprint is built by first listing all the actors involved in the service process on a vertical axis, and all the steps required to deliver the service on the horizontal axis. The resulting matrix allows to represent the flow of actions that each role needs to perform along the process, highlighting the actions that the user can see (above the line of visibility) and the ones that happen in the back-office (below the line of visibility). Roles can be performed by human beings or other types of entities (organizations, departments, artificial intelligences, machines, etc.).
Use it to Understand cross-functional relationships and align front-stage and back-stage processes.
Remember to use it to analyse an existing service or specify a well defined concept, not as an ideation tool.
Personas [4]
Each persona is a reference model representative of a specific type of users. Technically, they can be called behavioral archetypes when they focus on capturing the different behaviors (e.g. “the conscious chooser”) without expressing a defined personality or socio-demographics. The more the archetypes assume a realistic feeling (e.g. name, age, household composition, etc.), the more they become real personas, fully expressing the needs, desires, habits and cultural backgrounds of specific groups of users.
Use it to remember who you design for and get inspired by their specific life and challenges.
Remember to avoid enriching their descriptions with details that are not relevant in that context: they could be misleading.
System Map [5]
A system map is a synthetic representation that shows in one single frame all the different actors involved in a service delivery, and their mutual links (e.g. flows of materials, energy, information, money, documents, etc.). The system map clarifies how the different service components and roles are connected one to the other, highlighting the values they exchange.
Use it to understand the service dynamics, detect gaps and opportunities.
Remember to connect the components in loops: there is always an input and output under each exchange.
SMART goals technique [6]
The SMART goals technique, first described by George T. Doran [7], was developed to support applicants by achieving tasks through following the SMART guideline. The acronym SMART stands for: Specific, Measurable, Achievable, Relevant (sometimes: relatable), Time bound. The formulation of goals in a specific way demands that it is precise and clear what is supposed to be achieved by it. Making a goal measurable ensures a better controlling of them. By making a goal “achievable”, a project manager should make sure, that the process is elaborate regarding time, cost and human resources. Also, each goal should not exceed a certain amount of work but be divided into smaller work packages. The “relevant” aspect asks the applicant to evaluate the goal regarding its relevance to the project. Finally, the goal should also have a deadline assigned to it.[8] The formulation of any goal according to this standard allows the applicant to reach them in a more efficient way. Its simple application has made the SMART technique popular with both, private and professional goal setting. Additionally, one of the many advantages the technique offers is its great compatibility with other tools, such as the Eisenhower Matrix.[9]
Work Breakdown structure and Product breakdown structure [10]
According to the Project Management Insitiute’s Book of Knowledge (PMBOK), the work-breakdown structure (WBS) “is the process of subdividing project deliverables and project work into smaller, more manageable components.”[11]. This helps the project manager to not only make the project more manageable by having more control over smaller steps and a guidance for schedule development but also more predictable regarding time and cost estimations. [12]
WBS is breaking down a project hierarchically and incrementally into phases, deliverables and work packages, forming a tree structure. The development process of the WBS starts at the goal or end objective and is structured into several milestones, ultimately reaching back to the project’s start. Each milestone can then be further subdivided into manageable tasks rearding its size and duration. One great advantage is that these smaller tasks can be formulated with the above-mentioned SMART-goals technique to make them easier to achieve. [13] Like the WBS is the product breakdown structure (PBS) which does an analogous breakdown of the product. Even though its process and structure are fairly similar to the WBS, it is an isolated entity and is applied at a different stage in the planning process.[14]
The 5-Why method [15]
The 5-Why method is a problem-solving technique to detect a problem’s root cause. By asking “why”, the iterative interrogation method seeks for a starting issue’s root cause. The answer (cause) of the preceded problem then builds the basis for the next round of investigation. By repeating this process and further investigating the answer to each issue then again, one eventually reaches the central issue or key problem of an occurring difficulty. The method is mostly applied in “troubleshooting, quality improvement, and problem solving, but it is most effective when used to resolve simple or moderately difficult problems”[16]. The easily understandable technique was initially described by Taiichi Ohno, the architect of the Toyota Production System in the 1950s, in his book Toyota Production System: Beyond Large-Scale Production as “the basis of Toyota’s scientific approach . . . by repeating why five times, the nature of the problem as well as its solution becomes clear”. [17]
Sustainability Impact Assessment (SIA) [18]
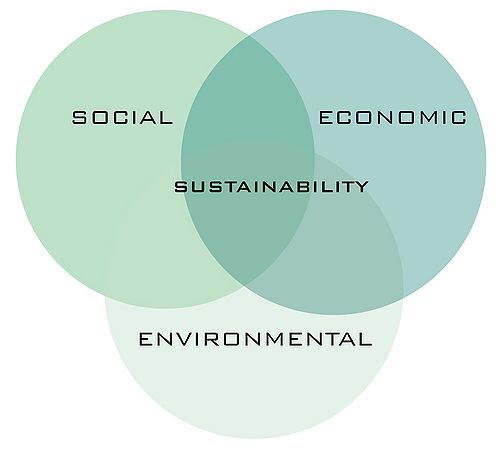
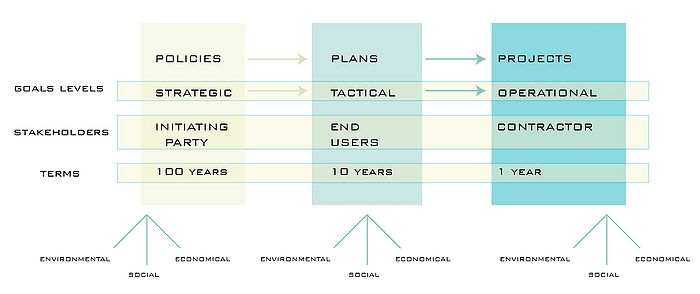
The tool SIA (Sustainability Impact Assessment) is defined by OECD (Organisation for Economic Co-operation and Development) [19] in 2010 based on the “Three-pillar thinking” model. The latter considers sustainability composed of Environmental, Social and Economic aspects. Nevertheless, is not sufficient since it does not take into consideration multiple perspectives regarding the impacts. SIA simulates future scenarios and it is a user-oriented tool connected to users’ perspectives. The impacts are categorized in the different goals levels: operational, tactical and strategic. Every step is then connected to the “Three-pillar thinking” model returning a nine categories framework. Every area involves different stakeholders with different interests. These are the key to address the widest range of issues – both drawbacks and benefits- regarding a project and to assess a weighted parameter to each of them. By doing so, predictability is increased and risk reduced leading to a better outcome.
Value Proposition Canvas [20]
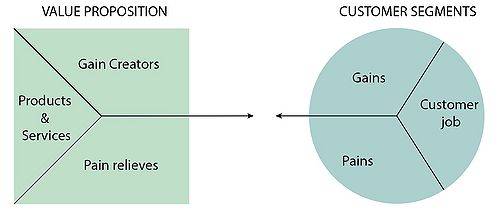
The Value Proposition Canvas is a management tool based on the Business Model Canvas, developed by Alexander Osterwalder in 2005. In particular, it focuses on the “Customer” and “Value proposition” segments specifying what value can be created for the customers.[21] [22]
The “Customer segment” assesses the reasons to initiate a project addressing issues regarding the customers.
Customer job: what jobs the customer wants to accomplish
Pains: issues that the customer could experience before, during and after the job is done
Gains: customer’s desires considered like extra benefits
The “Value proposition” focuses on the aspects of the project:
Products & Services: list of products and services delivered by the project
Pain relievers: connected to the “pain” section, it highlights solutions to solve customer’s problems
Gain creators: added-value for the client created by products and services
Stakeholder Map
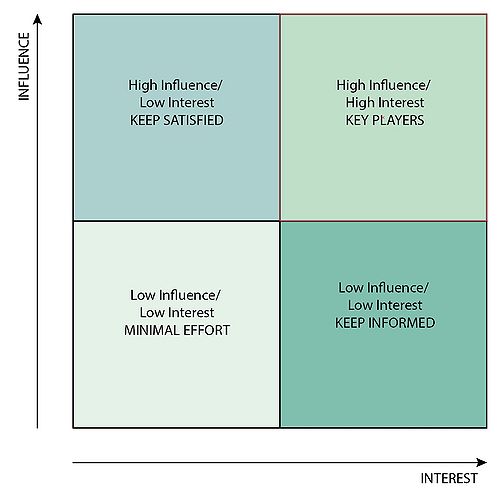
Stakeholders are defined as “individuals and organizations who are actively involved in the project, or whose interests may be positively or negatively affected as a result of project execution or successful project completion”. [24]
A stakeholder analysis is required to identify and classify the stakeholders based on their interests, importance, and influence on the project.[25] The visual representation of the analysis is called “Stakeholder map”, in which “Influence” states the power of the stakeholder on decisions. Whereas, the level at which a decision is crucial is addressed by the “Interest”.
PERT Chart[26]
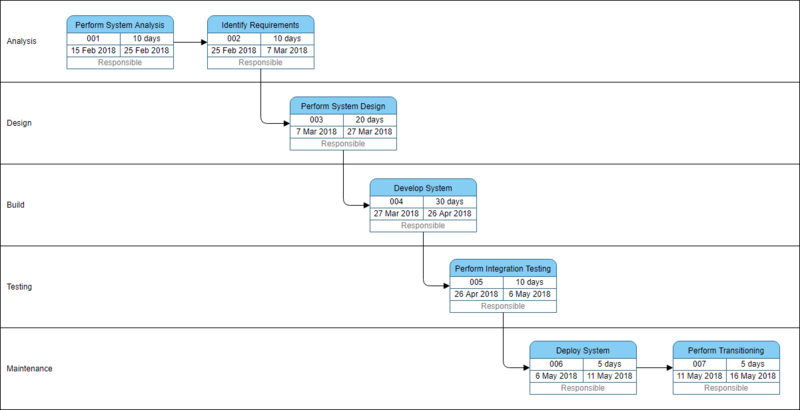
PERT Chart (Program Evaluation Review Technique) is a network-based analysis tool used to identify tasks in a complex project. It was developed by the U.S. Navy in 1957 to sustain the Polaris nuclear submarine project. [27]. Facilitation in decision making allows time and cost reduction. PERT Chart aims to determine the minimum amount of time to complete a project in which multiple tasks are interconnected. Moreover, it considers priorities, need for review due to delays and cost of a project. The chart is composed of
Tasks: contain Name, ID, Duration, Start-End date. Some of these tasks are called “critical activities” because a delay in one of them returns a delay in the entire project. Not critical activities instead tolerate a delay margin (slack time)
Dependency: time relationship within the tasks. The representation through arrows identifies the subsequences of actions drawing a series of paths.
PDCA and Input-Output
A tool that helps to monitor a process is the INPUT-OUTCOME pattern based on the “Quality Circle” (or PDCA) model (PLAN > DO > CHECK > ACT). [29] The latter was developed by the management consultant Dr. William Edwards Deming in the 1950s. The circle helps to identify the causes of failure and to improve changes testing them in a continuous feedback loop. Successful solutions are then implemented.
During the “Plan” step, is important to identify the accessible resources capable of return a certain degree of value and the aims. The management of the interventions required belongs to the “Do” phase. The “Check” stage concerns the evaluation of the outputs, which means the performances achieved, and the outcome, that is the impact on the stakeholders. Through the “Act” phase, the process is evaluated and improved.
Design Thinking
Design Thinking is an iterative process in which we seek to understand the user, challenge assumptions, and redefine problems in an attempt to identify alternative strategies and solutions that might not be instantly apparent with our initial level of understanding. [31] Design thinking is most commonly associated with prescriptions for the innovation of products and services within business and social contexts.[32] According to Hasso-Plattner Institute of Design at Stanford, Design Thinking usually has the following five phases: Emphatise with you users, Define – your users’ needs, their problem, and your insights, Ideate – by challenging assumptions and creating ideas for innovative solutions, Prototype – to start creating solutions, and, Test – solutions[33] which should be executed in this order for the process to be complete. However, in practice, the process is often carried out in a more flexible and non-linear fashion.[34] Often, Design Thinking is often referred to as ‘outside the box’ thinking.
Critical Path Method
The critical path method is a way to schedule a project work. Typically there are several activities conducted simultaneously within the project. These activities could have dependencies based on which paths are created. The time for each activity to be completed is identified and the longest path is found and deemed to be critical. The shortest time to complete the project is set by critical path, thus it is essential to have on time delivery of all activities bounded to critical path. Other paths might have floats or delays which will not cause any additional costs as long as the total path time won’t exceed the total critical path time.[35]
Decision Tree A decision tree is a tool which aids in decision making by forming a tree-like graph. The graph helps to visualize various decisions and their associated consequences, including the probability of a given event to happen, costs and resources. One can distinguish between three types of nodes while designing decision tree. These are decision nodes represented by squares, chance nodes represented by circles and end nodes represented by triangles. The most popular fields of applications for decision tree are operations research, operations management and machine learning. [36]
Maslow Hierarchy of Needs
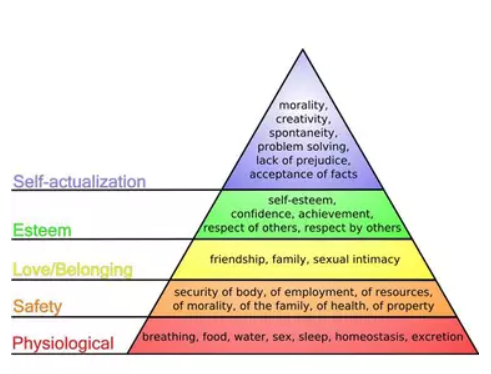
Maslow's hierarchy of needs is a motivational theory in psychology comprising a five-tier model of human needs, often depicted as hierarchical levels within a pyramid. Needs lower down in the hierarchy must be satisfied before individuals can attend to needs higher up. From the bottom of the hierarchy upwards, the needs are: physiological, safety, love and belonging, esteem, and self-actualization. [37] Maslow's theory in relevant for Project Management in the following way: Project management involves people and their needs. A project management process that meets all of the needs of related parties is far more likely to succeed. Unmet needs can affect the progress of a project, and tackling these needs in the correct hierarchy will greatly help the chances of meeting the desired targets. The needs adjusted for Project Management from bottom up and corresponding to the original theory would be: Resources (Psychological), Stability (Safety), Business Purpose (Belonging and Love), Esteem, and Delivery and Completion (Self-actualization). [38]
LCA [40]
What is life cycle assessment? Life cycle assessment is the factual analysis of a product’s entire life cycle in terms of sustainability.
LCA is a standardized methodology, which gives it its reliability and transparency. Standards provided by ISO 14040 and 14044.

ENVIRONMENTAL POLICIES [41]
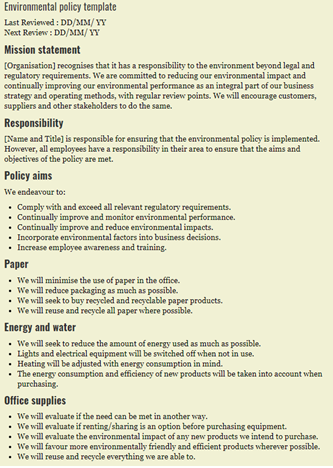
Environmental policy is the commitment of an organization or government to the laws, regulations, and other policy mechanisms concerning environmental.
ECOBALANCE [42]
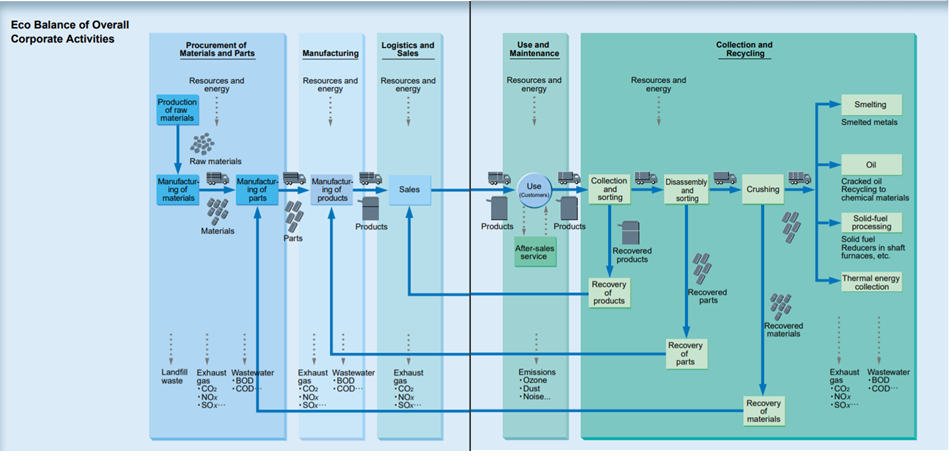
The EcoBalance model estimates the total consumption of energy and other natural resources, the production of emissions and wastes and the costs caused directly and indirectly by urban structures and transportation on a life cycle basis
[edit] References
- ↑ Project Management Institute, Inc.. (2017). Guide to the Project Management Body of Knowledge (PMBOK® Guide) (6th Edition). (pp. 513). Project Management Institute, Inc. (PMI). Retrieved from https://app-knovel-com.proxy.findit.dtu.dk/web/view/khtml/show.v/rcid:kpGPMBKP02/cid:kt011DXO32/viewerType:khtml//root_slug:13-project-stakeholder-management/url_slug:project-stakeholder-management?kpromoter=federation&b-toc-cid=kpGPMBKP02&b-toc-root-slug=&b-toc-url-slug=project-stakeholder-management&b-toc-title=Guide%20to%20the%20Project%20Management%20Body%20of%20Knowledge%20(PMBOK%C2%AE%20Guide)%20(6th%20Edition)&page=11&view=collapsed&zoom=1
- ↑ Ronald K. Mitchell, Bradley R. Agle, Donna J. Wood. The Academy of Management Review, Vol. 22, No. 4, 1997, p872
- ↑ (2007) Mary Jo Bitner, Amy L. Ostrom, Felicia N. Morgan, Service Blueprinting: A Practical Tool for Service Innovation, Centre for Services Leadership, Arizona State University, paper
- ↑ (2009) Kim Goodwin, Designing for the Digital Age: How to Create Human-centered Products and Services, John Wiley & Sons.
- ↑ (2007) Nicola Morelli, New representation techniques for designing in a systemic perspective, paper presented at Design Inquires, Stokholm.
- ↑ Doran, G. T. (1981). "There's a S.M.A.R.T. way to write management's goals and objectives". Management Review. 70(11): 35–36., Retrieved February 22, 2020
- ↑ Doran, G. T. (1981). "There's a S.M.A.R.T. way to write management's goals and objectives". Management Review. 70(11): 35–36., Retrieved February 22, 2020
- ↑ Doran, G. T. (1981). "There's a S.M.A.R.T. way to write management's goals and objectives". Management Review. 70(11): 35–36., Retrieved February 22, 2020
- ↑ https://www.habitify.me/blog/why-goal-setting-is-important-for-leaders
- ↑ 2008 Project Management Institute. A Guide to the Project Management Body of Knowledge (PMBOK® Guide) — Fourth Edition
- ↑ 2008 Project Management Institute. A Guide to the Project Management Body of Knowledge (PMBOK® Guide), p. 49 — Fourth Edition
- ↑ Booz, Allen & Hamilton Earned Value Management Tutorial Module 2: Work Breakdown Structure, Office of Science, Tools & Resources for Project Management, science.energy.gov. Retrieved February 22, 2020
- ↑ NASA (2001). NASA NPR 9501.2D, https://nodis3.gsfc.nasa.gov/displayCA.cfm?Internal_ID=N_PR_9501_002D_&page_name=Chp2, Retrieved Feburary 22, 2020.
- ↑ Duncan Haughey. (2015) ‘Project Management Tools’, Project Smart. Available from: https://www.projectsmart.co.uk/project-management-tools.php
- ↑ https://www.mindtools.com/pages/article/newTMC_5W.htm
- ↑ https://www.mindtools.com/pages/article/newTMC_5W.htm
- ↑ https://open.buffer.com/5-whys-process/
- ↑ Ola Laedre, Tore Haavaldsen, Rolf André Bohne, James Kallaos & Jardar Lohne (2015) Determining sustainability impact assessment indicators, Impact Assessment and Project Appraisal, 33:2, 98-107, DOI: 10.1080/14615517.2014.981037
- ↑ https://en.wikipedia.org/wiki/OECD
- ↑ Osterwalder, Alexander and Pigneur, Yves, (2010) Business Model Generation
- ↑ http://apppm.man.dtu.dk/index.php/Value_Proposition_Canvas
- ↑ https://strategyzer.com
- ↑ www.Strategyzer.com
- ↑ 1- Project Management Institute (PMI®), 1996
- ↑ Smith, L. W. (2000). Stakeholder analysis: a pivotal practice of successful projects. Paper presented at Project Management Institute Annual Seminars & Symposium, Houston, TX. Newtown Square, PA: Project Management Institute
- ↑ http://apppm.man.dtu.dk/index.php/PERT/CPM
- ↑ https://www.investopedia.com/terms/p/pert-chart.asp
- ↑ https://online.visual-paradigm.com/diagrams/tutorials/pert-chart-tutorial/
- ↑ Facilities management models, methods and tools. Research results for practice”, Jensen (2019)
- ↑ Pic based on “Model for Value-Adding Management” included in ”Facilities management models, methods and tools. Research results for practice”, Jensen (2019)/
- ↑ https://www.interaction-design.org/literature/article/what-is-design-thinking-and-why-is-it-so-popular
- ↑ Tim Brown. Design Thinking. Harvard Business Review, June 2008.
- ↑ https://www.interaction-design.org/literature/article/5-stages-in-the-design-thinking-process
- ↑ https://www.interaction-design.org/literature/article/5-stages-in-the-design-thinking-process
- ↑ http://production.datastore.cvt.dk/filestore?oid=5a14723f5010df36af59f816&targetid=5a14723f5010df36af59f81a
- ↑ 2008 Project Management Institute. A Guide to the Project Management Body of Knowledge (PMBOK® Guide) — Fourth Edition
- ↑ https://www.simplypsychology.org/maslow.html
- ↑ https://www.brighthubpm.com/monitoring-projects/50474-maslows-hierarchy-for-project-management/
- ↑ https://www.brighthubpm.com/monitoring-projects/50474-maslows-hierarchy-for-project-management/
- ↑ (2009) Chapter 2 Life Cycle Management: Implementing Sustainability in Business Practice, Guido Sonnemann , Eskinder Demisse Gemechu , Arne Remmen ,Jeppe Frydendal.
- ↑ (2009) Chapter 2 Life Cycle Management: Implementing Sustainability in Business Practice, Guido Sonnemann , Eskinder Demisse Gemechu , Arne Remmen ,Jeppe Frydendal.
- ↑ (2009) Chapter 2 Life Cycle Management: Implementing Sustainability in Business Practice, Guido Sonnemann , Eskinder Demisse Gemechu , Arne Remmen ,Jeppe Frydendal.
![Figure 1: PDCA and Input-Output Model [30]](/images/thumb/3/3f/INPUT_OUTPUT.jpg/500px-INPUT_OUTPUT.jpg)
