Implementing Target Value Design
(→Irritative Design Process) |
(→Irritative Design Process) |
||
| (45 intermediate revisions by 3 users not shown) | |||
| Line 10: | Line 10: | ||
==Irritative Design Process== | ==Irritative Design Process== | ||
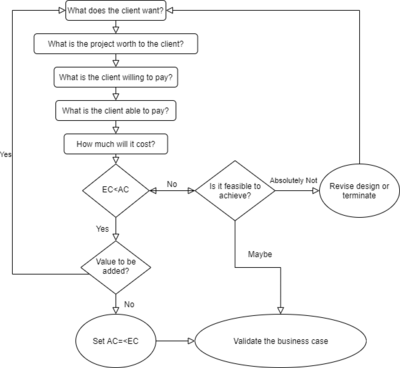
| − | The design process is an irritative process, which is meant to best optimise and deliver the final value for the client. Below is shown a flow chart of a TVD design process chart. [[File:IrritativeDesignProcess.png| | + | The design process is an irritative process, which is meant to best optimise and deliver the final value for the client. Below is shown a flow chart of a TVD design process chart. [[File:IrritativeDesignProcess.png|400px|thumb|right|Figure 1: Irritative Design Process.]] |
The initial five steps of the flow chart all concern establishing or verifying the clients project visualization and funds. It is apparent that the main constraint on a TVD project is the cost. The design is never moved forward with if the cost exceeds the Allowable Cost, and therefore, the design and construction of the project spend a lot of effort developing innovative solutions to make the project cheaper. If at the end of the process the cost have been driven down far enough so that there may be excess money available, the process changes to see if any value can be added for the remaining money. The final result will be an optimised design which costs as close to the target value as possible, but never more than the target value. | The initial five steps of the flow chart all concern establishing or verifying the clients project visualization and funds. It is apparent that the main constraint on a TVD project is the cost. The design is never moved forward with if the cost exceeds the Allowable Cost, and therefore, the design and construction of the project spend a lot of effort developing innovative solutions to make the project cheaper. If at the end of the process the cost have been driven down far enough so that there may be excess money available, the process changes to see if any value can be added for the remaining money. The final result will be an optimised design which costs as close to the target value as possible, but never more than the target value. | ||
| Line 37: | Line 37: | ||
SWOT analysis is a management tool which gives a fundamental framework for situational analysis and it can be used when developing strategies. SWOT stands for internal strengths and weaknesses of for example companies and external opportunities and threats that companies have to face and cannot control. | SWOT analysis is a management tool which gives a fundamental framework for situational analysis and it can be used when developing strategies. SWOT stands for internal strengths and weaknesses of for example companies and external opportunities and threats that companies have to face and cannot control. | ||
| − | + | * The internal factors; strengths and weaknesses, indicate that there are forces that occur from the inside of the company and they can be changed over time with a lot of work. Strengths and weaknesses are for example a company’s reputation, location, recourses, cost and time estimates to name a few. | |
| − | + | * The external factors; opportunities and threats, indicate that there are external forces that occur and they have impact on the company without it being able to do anything about it, they cannot be changed over time like the internal forces. Opportunities and threats can be for example competitors, suppliers, market, weather conditions etc <ref name="SWOT">Parsons, N. (2019, September 12). What Is a SWOT Analysis, and How to Do It Right (With Examples). Retrieved from https://www.liveplan.com/blog/what-is-a-swot-analysis-and-how-to-do-it-right-with-examples/</ref>. | |
| − | This tool can assist analysing a company’s current or future state which gives a clearer vision of what needs to be focused on to improve or be prepared for <ref name=" | + | This tool can assist analysing a company’s current or future state which gives a clearer vision of what needs to be focused on to improve or be prepared for <ref name="SWOT">Section 14. SWOT Analysis: Strengths, Weaknesses, Opportunities, and Threats. (n.d.). Retrieved from https://ctb.ku.edu/en/table-of-contents/assessment/assessing-community-needs-and-resources/swot-analysis/main</ref>. |
===Fishbone diagram=== | ===Fishbone diagram=== | ||
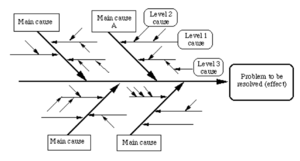
| − | Fishbone diagram (Ishikawa) is a problem solving tool | + | [[File: fishbone1.png |300px|thumb|right|Figure 2: Fishbone diagram]] |
| − | The causes of the | + | Fishbone diagram (Ishikawa) is a problem solving tool which was developed to reveal causes (process) and effects (result). It is good to use this tool to find the real causes of root problems in companies. The diagram is formed like a fish and the “head” of the fish is where the problem that needs to be solved is located <ref name="FISH">Imai, M. (2012). Gemba kaizen: a commonsense approach to a continuous improvement strategy. New York: McGraw Hill.</ref>. |
| + | The causes of the effects, which are at least four, are arrows that acts like the “backbone” of the fish and are categorised into different types along the branches. For every branch, there is a specific factor which may be a cause of the effect needs to be identified. The diagram focuses on a specific issue and identifies areas that lack data and an identification needs to be organised under related causes. After the root causes to the problem have been identified, an analysation is required on the diagram with for example Pareto Chart to determine on which cause to focus on first and what are the next steps <ref name="FISH1">IRouse, M. (2019, November 7). What is a Fishbone Diagram (Ishikawa Cause and Effect Diagram)? Retrieved from https://whatis.techtarget.com/definition/fishbone-diagram</ref>. | ||
===Set Based Concurrent Design=== | ===Set Based Concurrent Design=== | ||
Set Based Concurrent Design (SBCD) is an alternative approach to product development which is aimed at lowering the time and cost and achieving a more optimised final product. | Set Based Concurrent Design (SBCD) is an alternative approach to product development which is aimed at lowering the time and cost and achieving a more optimised final product. | ||
| − | + | '''Traditional Point-Based Approaches to Product Development vs SBCD''' | |
| + | |||
One may have heard of the classic waterfall process or the “over the wall” design method. These are all names for the classic point-based serial engineering approach for a product development. In the extreme version of the traditional approach it should be thought that stages and tasks follow one another in a linear manner, meaning that no later task will be initiated until a previous task is complete. | One may have heard of the classic waterfall process or the “over the wall” design method. These are all names for the classic point-based serial engineering approach for a product development. In the extreme version of the traditional approach it should be thought that stages and tasks follow one another in a linear manner, meaning that no later task will be initiated until a previous task is complete. | ||
| Line 56: | Line 58: | ||
===Business Case=== | ===Business Case=== | ||
| + | A business case is relevant for all projects as it is a foundation and justification for doing a project. It contains several important justifications and brief evaluations of the project. For a Target Value Design project, a business case is an important part of determining what is value for the client or project owner. The type of business case as mentioned below will highlight why this project in particular creates value for its owner. Another application for this tool is to set the Target Value and sticking to it. A very important part of TVD is to never go above the Target Value. The business document will set the boundaries for justification of the project. If these boundaries are exceeded, the project is no longer justified. A well thought trough and used business case document might therefore help the TVD team working within the Target Value. | ||
| + | A business case is simply a document which explains and justifies why a particular project is of value for a business. There are many ways to evaluate the value of a project, and many ways of creating a Business case document. However, the document needs to contain the most important information about the project. This might be, but is not limited to: | ||
| − | + | * Reasons for execution | |
| + | |||
| + | * Alternative options for the project | ||
| + | |||
| + | * Timeframe and schedule | ||
| + | |||
| + | * Cost estimates | ||
| + | |||
| + | * A risk and opportunity analysis | ||
| + | |||
| + | * Advantages and disadvantages | ||
| + | |||
| + | Several issues might arise if a project is not anchored with a Business case. Mainly the business might execute projects which are not benefitable for the organization. As a result the business wastes resources on projects without benefiting from them. Further on a Business case will establish a basis for prioritizing projects, if done correctly. Creating a common sense of what is value will help all employees understand which project creates most value and therefore which project should be prioritized. | ||
===PDCA=== | ===PDCA=== | ||
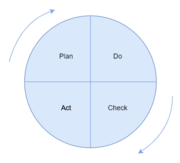
| − | PDCA (Plan-Do-Check-Act) is a four step model used to carry out change <ref name="PDCA">Alyoubi, M., Alqahtani, J., & Aziz, A. A. (2017). Quality Improvement Methodologies – PDCA Cycle and Six Sigma in E-learning System. ''Iarjset, 4''(5), 95–99. </ref> | + | [[File:PDCA-TVD.PNG|180px|thumb|right|Figure 3: PDCA (Plan-Do-Check-Act) cycle.]] |
| + | PDCA (Plan-Do-Check-Act) is a four step model used to carry out change. <ref name="PDCA">Alyoubi, M., Alqahtani, J., & Aziz, A. A. (2017). Quality Improvement Methodologies – PDCA Cycle and Six Sigma in E-learning System. ''Iarjset, 4''(5), 95–99. </ref> The PDCA cycle should be repeated repeatedly for continuous improvement. The PDCA cycle is e.g. used when starting a new improvement project, when developing a new/improved design of a process/product/service and when planning data collection and analysis to find the root cause of a problem. Each procedure in the cycle is important: | ||
* Plan: Acknowledge an opportunity and plan a change. | * Plan: Acknowledge an opportunity and plan a change. | ||
| Line 68: | Line 85: | ||
===The A3 Report=== | ===The A3 Report=== | ||
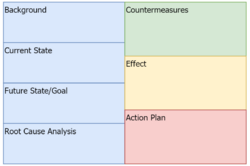
| − | [[File:A3-report.PNG| | + | [[File:A3-report.PNG|250px|thumb|right|Figure 4: Problem Solving A3 report.]] |
| − | An A3 report is an orderly document and is so named because it fits on one side of an A3 size paper. The idea behind A3 was developed by Toyota in the 1960’s and has been used since for problem-solving, proposals, plans, and status reviews <ref name="A3_1">Shook. (2010). ''Managing to Learn. Cambridge, MA: Lean Enterprise Institute, Inc. | + | An A3 report is an orderly document and is so named because it fits on one side of an A3 size paper. The idea behind A3 was developed by Toyota in the 1960’s and has been used since for problem-solving, proposals, plans, and status reviews. <ref name="A3_1">Shook. (2010). ''Managing to Learn.'' Cambridge, MA: Lean Enterprise Institute, Inc.</ref> It is a tool that is used to achieve successful integrated project delivery (IPD). A3’s are meant to support the initiation, development, sharing and documentation of ideas and information in organizational aspect. A3s are well suited to address the necessity of different disciplines working together. A3 reports follow the PDCA (plan-do-check-act) cycle. <ref name="A3_2">Gupta, A. P., Tommelein, I. D. & Blume, K. (n.d.). ''Framework for using A3s to develop shared understanding on projects.'' International Group for Lean Construction.</ref> There are three main types of A3: |
1) Problem Solving | 1) Problem Solving | ||
| Line 81: | Line 98: | ||
===IPD=== | ===IPD=== | ||
| − | Integrated Project Design (IPD) does not share a single definition. Actually, through literature and studies, several definitions are published, but all with the same goal. Therefore instead of giving a specific definition of IPD, it could be said that Integrated Project Delivery is a path that is attending to integrate people, systems business, structures and practices into a process that harness the different talents ad insights of all disciplines within a project to improve project results, increase the value for the owner, reduce waste and maximize efficiency through all faces of a project (Design, fabrication and construction).<ref name="IPD">The College. (2007). The American Institute of Architects College of Fellows. Washington, D.C.</ref> [[File:IPD.PNG|200px|thumb|right|Figure | + | Integrated Project Design (IPD) does not share a single definition. Actually, through literature and studies, several definitions are published, but all with the same goal. Therefore instead of giving a specific definition of IPD, it could be said that Integrated Project Delivery is a path that is attending to integrate people, systems business, structures and practices into a process that harness the different talents ad insights of all disciplines within a project to improve project results, increase the value for the owner, reduce waste and maximize efficiency through all faces of a project (Design, fabrication and construction).<ref name="IPD">The College. (2007). The American Institute of Architects College of Fellows. Washington, D.C.</ref> [[File:IPD.PNG|200px|thumb|right|Figure 5: Integrated Project Delivery.]] |
Implementation of IPD principles are varying from projects to projects, but the main goal is to achieve a collaboration early between the disciplines of a project to optimize efficiency. The IPD principles can early be established into the contractual agreements between the Owner, Lead designer, lead architect and others if needed. From this point, integrated projects are entirely dignified by efficient collaboration between the owner, the prime designer and the prime constructor that already in the early basis are commencing and doing it as the projects continue. | Implementation of IPD principles are varying from projects to projects, but the main goal is to achieve a collaboration early between the disciplines of a project to optimize efficiency. The IPD principles can early be established into the contractual agreements between the Owner, Lead designer, lead architect and others if needed. From this point, integrated projects are entirely dignified by efficient collaboration between the owner, the prime designer and the prime constructor that already in the early basis are commencing and doing it as the projects continue. | ||
| Line 87: | Line 104: | ||
===KPI=== | ===KPI=== | ||
| − | A Key performance indicator is a measurable value that helps a company by looking into how effectively a company is achieving its key business objectives. Normally, organizations use KPI at several levels to decide their success at reaching internal targets. Within KPI, we can divide between High-level KPI and Low-level KPI. In this case, High-level KPI focuses on the overall performance of the entire organization, while the low-level KPI focus on the process in smaller departments, for example, sales, Human Resources (HR), marketing and others. KPI itself is used broadly across an organization, so to minimize what KPI indicates we can divide KPI into several focus areas, these are: [[File:Test123.png|200px|thumb|right|Figure | + | A Key performance indicator is a measurable value that helps a company by looking into how effectively a company is achieving its key business objectives. Normally, organizations use KPI at several levels to decide their success at reaching internal targets. Within KPI, we can divide between High-level KPI and Low-level KPI. In this case, High-level KPI focuses on the overall performance of the entire organization, while the low-level KPI focus on the process in smaller departments, for example, sales, Human Resources (HR), marketing and others. KPI itself is used broadly across an organization, so to minimize what KPI indicates we can divide KPI into several focus areas, these are: [[File:Test123.png|200px|thumb|right|Figure 6: KPIs focus areas.]] |
| − | + | * Quality | |
| − | + | * Customer satisfaction | |
| − | + | * Delivery | |
| − | + | * Employees | |
| − | + | * Expenses | |
| − | + | * Efficiency | |
| Line 105: | Line 122: | ||
===Choosing by Advantage=== | ===Choosing by Advantage=== | ||
| + | [[File:CBAsteps123.png|300px|thumb|right|Figure 7: An illustration of the CBA steps.]] | ||
Choosing by Advantage (CBA) is a method used for decision making where the different alternatives are evaluated based on the priority of advantages they are offering related to a set of factors that contribute value to the project. The main purpose of implementing the CBA method is so that the stakeholders can examine which ideas that are presented are most likely to offer the most immense importance of advantages as well as evaluating the relative cost. In this method, decisions are based on advantages of alternatives. The alternatives are seen as positive differences, and not advantages and disadvantages to avoid double counting. CBA decision-making is often closely related to A3 reports. This is for documenting how the team came to solutions and the different factors used to make a decision. <ref name="CBA1">Alves, T., Lichting, W. and Rybkowski, Z. (2017). Implementing Target Value Design. “HERD: Health Environments Research & Design Journal”, 10(3), pp.18-29.</ref> <ref name="CBA2"> Arroyo, P. (2020). Lean Construction Blog. Retrieved 8 March 2020, from https://leanconstructionblog.com/applying-choosing-by-advantages-step-by-step.html</ref> | Choosing by Advantage (CBA) is a method used for decision making where the different alternatives are evaluated based on the priority of advantages they are offering related to a set of factors that contribute value to the project. The main purpose of implementing the CBA method is so that the stakeholders can examine which ideas that are presented are most likely to offer the most immense importance of advantages as well as evaluating the relative cost. In this method, decisions are based on advantages of alternatives. The alternatives are seen as positive differences, and not advantages and disadvantages to avoid double counting. CBA decision-making is often closely related to A3 reports. This is for documenting how the team came to solutions and the different factors used to make a decision. <ref name="CBA1">Alves, T., Lichting, W. and Rybkowski, Z. (2017). Implementing Target Value Design. “HERD: Health Environments Research & Design Journal”, 10(3), pp.18-29.</ref> <ref name="CBA2"> Arroyo, P. (2020). Lean Construction Blog. Retrieved 8 March 2020, from https://leanconstructionblog.com/applying-choosing-by-advantages-step-by-step.html</ref> | ||
| − | ===LPS=== | + | CBA as a tool can be done in seven steps, as followed: (1) Identify alternatives, (2) Define factors, (3) Define criteria for each actor, (4) Summarizing the attributes of each alternative, (5) Decide the advantages, (6) Decide the importance of each advantage and (7) evaluate cost data. These steps are shown in Figure 7. <ref name="CBA3"> Arroyo, P., Tommelein, I., & Ballard, G. (2013). Using "Choosing by Advantages" to select ceiling tile from a global sustainable perspective. Proceedings IGLC-21, 311.</ref> |
| + | |||
| + | This tool process is eminently collaborative between stakeholders, designers and other disciplines. After finding the most suitable alternative, they can go on to the next phase of the CBA Tabular Method of reconsidering the decision. By using this tool, the stakeholders can ask questions like: Are there any additional alternatives to be considered for this project? Does the importance of advantages accurately represent the viewpoint of the stakeholders? <ref name="CBA3"> Arroyo, P., Tommelein, I., & Ballard, G. (2013). Using "Choosing by Advantages" to select ceiling tile from a global sustainable perspective. Proceedings IGLC-21, 311.</ref> | ||
| + | |||
| + | ===Last Planner System=== | ||
| + | |||
| + | Last Planner System (LPS) as a tool was originally made as a solution for the inefficiency of the building industry and has over time evolved into a tool to control the workflow better. <ref name="LPS1"> Ćwik, K., & Rosłon, J. (2017). Last planner system in construction. MATEC Web Of Conferences, 117, 00032. doi: 10.1051/matecconf/201711700032</ref>. The system is regarding to the Lean Construction Institute, used for project production planning and control, and are aimed at creating a workflow that archives reliable execution <ref name="LPS2"> Lean Construction Institute (LCI) | Lean Project Design & Delivery. (2020). Retrieved 8 March 2020, from https://www.leanconstruction.org/</ref>. LPS is a collaborative planning process in which are used when the teams are getting close to actually doing the work. It is done in a opposite way when compared to conventional principles. LPS are using “pull planning” principles, where the work that CAN and WILL be done is considered and promised by Last Planners themselves <ref name="LPS3"> (2020). Retrieved 8 March 2020, from https://www.leanconstruction.org/media/docs/chapterpdf/israel/Last_Planner_System_Business_Process_Standard_and_Guidelines.pdf </ref>. Principles of LPS regarding to LeanConstruction.org is: | ||
| + | * Plan in greater detail as you get closer to doing the work | ||
| + | * Produce plans collaboratively with those who will do the work | ||
| + | * Reveal and remove constraints on planned tasks as a team | ||
| + | * Make and secure reliable promises | ||
== References == | == References == | ||
<references/> | <references/> | ||
Latest revision as of 17:30, 8 March 2020
[edit] Target Value Design
Target Value Design (TVD) is a design process involving extensive collaboration between a broad reach of stakeholders; designers, builders, suppliers, estimators and Owners co-located in one place to collaboratively produce a design that provides the best value for the Owner. The Target Value (or budget), is the lead design criterion. The TVD process, is an iterative process where the design is repeatedly optimized to achieve the desired end product, without over running cost and time.
Contents |
[edit] Problem scope
The design and construction industry is widely known for having frequent and at times substantial cost and time overruns. This not only hurts the industries public image, but also weakens potential clients trust in projects meeting target values. Especially private clients may be troubled by the financial uncertainties as they will have bigger issues absorbing cost increases than public client will.
TVD is effectively meant to eliminate these overruns, creating an increased level of trust, higher client satisfaction and a better reputation for the company and the industry. As part of the process projects will be subjected to redesign (savings) as they do not meet client expectation in terms of total cost and time. The idea is to manage and steer the cost down to the Target Value. In some cases it may also show that the Target Value is inappropriately low and any real useful project delivery is not feasible within the Target Value, however, this would indicate lack of experience on the client and advisors part.
[edit] Irritative Design Process
The design process is an irritative process, which is meant to best optimise and deliver the final value for the client. Below is shown a flow chart of a TVD design process chart.The initial five steps of the flow chart all concern establishing or verifying the clients project visualization and funds. It is apparent that the main constraint on a TVD project is the cost. The design is never moved forward with if the cost exceeds the Allowable Cost, and therefore, the design and construction of the project spend a lot of effort developing innovative solutions to make the project cheaper. If at the end of the process the cost have been driven down far enough so that there may be excess money available, the process changes to see if any value can be added for the remaining money. The final result will be an optimised design which costs as close to the target value as possible, but never more than the target value.
[edit] Contract Type
To achieve the greatest success in TVD projects, a shared risk contract should be used. A shared risk contract should at least include the client, principal designer and principal contractor as the signing parties. The contract should incentivise completing the project to the target value in the way of bonuses for the designer and contractor. In the instance that the project over runs costs, the designer and contractor should only be paid for their worked hours.
In case where organization may be prohibited to sign shared risk contracts – company/government policy etc. The client should instead create positive incentives in the way that when target milestones are successfully reached a monetary incentive is given/shared with the designers/contractors. The benefit of a shared risk contract is that it enhances the cooperation between designers and contractors to ensure that the design can also be constructed to the cost and time available. As every party is penalized I the project is not delivered contractors should naturally be more involved in the design process and designers in the construction phase.
[edit] Managing the Design Process
Research into Target Value Design and Delivery show that a good work and management culture is important to the success. Often used as good reference is LEAN management as first invented and implemented by Toyota. It is further advised to collocate the stakeholders, so that they naturally will cooperate more by being in the same room. The more of the stakeholder who can be present the better. In other words, if consultant designers and sub-contractors can be part of the initial design process as well then the smoother the design process is meant to be. Collocation has been shown to smooth out the design process, and help maximise the work not done, as designers can quickly consult contractors and draw on their expertise and knowledge of the cost to build the different design options.
It is also beneficial to have at least one person which is educated in LEAN management to help direct the colocation offices and meetings held, to ensure that everyone is encouraged to share their knowledge and expertise. Although the concept of irritative design processes to ensure a TVD may seem quite straight forward, there is a need for the project manager to closely steer the projects in the cost optimising direction so as to achieve a true TVD.
[edit] Concerns
A common concern regarding a transition to TVD within the AEC industry appear to be linked with quality and innovation. There is a concern that the quality will go down if the cost is kept low, and that there will be no space for innovation. However, people in the field suggest that the need to stick so closely to the target can in fact inspire the need for innovation in order to deliver a design to meet the quality required. Hence, some have found that it creates a larger drive for innovative solutions to cut the cost without demeaning the quality.
The companies who have implemented TVD appeared to meet resistance and scepticism from architects and engineers at first, but then once implemented received positive feedback and TVD.
[edit] Tools to implement TVD
[edit] SWOT
SWOT analysis is a management tool which gives a fundamental framework for situational analysis and it can be used when developing strategies. SWOT stands for internal strengths and weaknesses of for example companies and external opportunities and threats that companies have to face and cannot control.
- The internal factors; strengths and weaknesses, indicate that there are forces that occur from the inside of the company and they can be changed over time with a lot of work. Strengths and weaknesses are for example a company’s reputation, location, recourses, cost and time estimates to name a few.
- The external factors; opportunities and threats, indicate that there are external forces that occur and they have impact on the company without it being able to do anything about it, they cannot be changed over time like the internal forces. Opportunities and threats can be for example competitors, suppliers, market, weather conditions etc [1].
This tool can assist analysing a company’s current or future state which gives a clearer vision of what needs to be focused on to improve or be prepared for [1].
[edit] Fishbone diagram
Fishbone diagram (Ishikawa) is a problem solving tool which was developed to reveal causes (process) and effects (result). It is good to use this tool to find the real causes of root problems in companies. The diagram is formed like a fish and the “head” of the fish is where the problem that needs to be solved is located [2]. The causes of the effects, which are at least four, are arrows that acts like the “backbone” of the fish and are categorised into different types along the branches. For every branch, there is a specific factor which may be a cause of the effect needs to be identified. The diagram focuses on a specific issue and identifies areas that lack data and an identification needs to be organised under related causes. After the root causes to the problem have been identified, an analysation is required on the diagram with for example Pareto Chart to determine on which cause to focus on first and what are the next steps [3].
[edit] Set Based Concurrent Design
Set Based Concurrent Design (SBCD) is an alternative approach to product development which is aimed at lowering the time and cost and achieving a more optimised final product.
Traditional Point-Based Approaches to Product Development vs SBCD
One may have heard of the classic waterfall process or the “over the wall” design method. These are all names for the classic point-based serial engineering approach for a product development. In the extreme version of the traditional approach it should be thought that stages and tasks follow one another in a linear manner, meaning that no later task will be initiated until a previous task is complete.
Set Based Concurrent Design (SBCD) takes a different approach in reaching the final design than the classic method. SBCD will carry on multiple designs for a longer period before comparing and getting the designs down to a smaller number. Note that the final design may not be one design, but a few designs for different ranges (in case of a product development). The ability to look and develop many sub designs within each subsystem allows for a much better final, result than if the sorting process is done early and at a less informed time.
[edit] Business Case
A business case is relevant for all projects as it is a foundation and justification for doing a project. It contains several important justifications and brief evaluations of the project. For a Target Value Design project, a business case is an important part of determining what is value for the client or project owner. The type of business case as mentioned below will highlight why this project in particular creates value for its owner. Another application for this tool is to set the Target Value and sticking to it. A very important part of TVD is to never go above the Target Value. The business document will set the boundaries for justification of the project. If these boundaries are exceeded, the project is no longer justified. A well thought trough and used business case document might therefore help the TVD team working within the Target Value. A business case is simply a document which explains and justifies why a particular project is of value for a business. There are many ways to evaluate the value of a project, and many ways of creating a Business case document. However, the document needs to contain the most important information about the project. This might be, but is not limited to:
- Reasons for execution
- Alternative options for the project
- Timeframe and schedule
- Cost estimates
- A risk and opportunity analysis
- Advantages and disadvantages
Several issues might arise if a project is not anchored with a Business case. Mainly the business might execute projects which are not benefitable for the organization. As a result the business wastes resources on projects without benefiting from them. Further on a Business case will establish a basis for prioritizing projects, if done correctly. Creating a common sense of what is value will help all employees understand which project creates most value and therefore which project should be prioritized.
[edit] PDCA
PDCA (Plan-Do-Check-Act) is a four step model used to carry out change. [4] The PDCA cycle should be repeated repeatedly for continuous improvement. The PDCA cycle is e.g. used when starting a new improvement project, when developing a new/improved design of a process/product/service and when planning data collection and analysis to find the root cause of a problem. Each procedure in the cycle is important:
- Plan: Acknowledge an opportunity and plan a change.
- Do: Test the change.
- Check: Review the test, analyze the results and identify what has been learned.
- Act: Action is taken. If the plan was successful, integrate what has been learned to broader changes which can then be used to plan new improvements. However, if the change didn’t go as planned, go through the cycle again with a different plan.
[edit] The A3 Report
An A3 report is an orderly document and is so named because it fits on one side of an A3 size paper. The idea behind A3 was developed by Toyota in the 1960’s and has been used since for problem-solving, proposals, plans, and status reviews. [5] It is a tool that is used to achieve successful integrated project delivery (IPD). A3’s are meant to support the initiation, development, sharing and documentation of ideas and information in organizational aspect. A3s are well suited to address the necessity of different disciplines working together. A3 reports follow the PDCA (plan-do-check-act) cycle. [6] There are three main types of A3:
1) Problem Solving
2) Proposal
3) Status
Problem Solving A3 report (see figure) is the most common of the A3 reports.
[edit] IPD
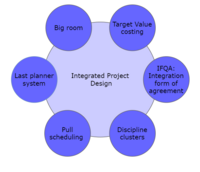
Integrated Project Design (IPD) does not share a single definition. Actually, through literature and studies, several definitions are published, but all with the same goal. Therefore instead of giving a specific definition of IPD, it could be said that Integrated Project Delivery is a path that is attending to integrate people, systems business, structures and practices into a process that harness the different talents ad insights of all disciplines within a project to improve project results, increase the value for the owner, reduce waste and maximize efficiency through all faces of a project (Design, fabrication and construction).[7]Implementation of IPD principles are varying from projects to projects, but the main goal is to achieve a collaboration early between the disciplines of a project to optimize efficiency. The IPD principles can early be established into the contractual agreements between the Owner, Lead designer, lead architect and others if needed. From this point, integrated projects are entirely dignified by efficient collaboration between the owner, the prime designer and the prime constructor that already in the early basis are commencing and doing it as the projects continue. From an early collaboration within all disciplines, it is possible to align interest, objectives and practices early. With IPD we get combines ideas from integrated practice and lean construction to solve several problems such as general waste, over budgeting and low productivity. This can be done in various ways. The workload can be iterated in a way to maximize the value so that the waste is heavily reduced at the project delivery level. At the earlier stage, the contract can include contingency with profit at risks and shared savings if the projects get delivered under budget. In addition, the growing use of BIM allows the industry for far better collaboration at the early stage and throughout the project and is important for projects implementing IPD to increase the productivity in the project.
[edit] KPI
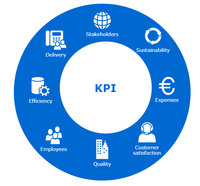
A Key performance indicator is a measurable value that helps a company by looking into how effectively a company is achieving its key business objectives. Normally, organizations use KPI at several levels to decide their success at reaching internal targets. Within KPI, we can divide between High-level KPI and Low-level KPI. In this case, High-level KPI focuses on the overall performance of the entire organization, while the low-level KPI focus on the process in smaller departments, for example, sales, Human Resources (HR), marketing and others. KPI itself is used broadly across an organization, so to minimize what KPI indicates we can divide KPI into several focus areas, these are:- Quality
- Customer satisfaction
- Delivery
- Employees
- Expenses
- Efficiency
In addition to implementing KPI, it is essential to regularly check your set KPIs. This will help with the maintenance of the KPI, as well as development of the KPI for the business. Therefore, tracking KPI is one of the most important tools to progress how successful the organization is at any given time. [8] [9]
[edit] Choosing by Advantage
Choosing by Advantage (CBA) is a method used for decision making where the different alternatives are evaluated based on the priority of advantages they are offering related to a set of factors that contribute value to the project. The main purpose of implementing the CBA method is so that the stakeholders can examine which ideas that are presented are most likely to offer the most immense importance of advantages as well as evaluating the relative cost. In this method, decisions are based on advantages of alternatives. The alternatives are seen as positive differences, and not advantages and disadvantages to avoid double counting. CBA decision-making is often closely related to A3 reports. This is for documenting how the team came to solutions and the different factors used to make a decision. [10] [11]
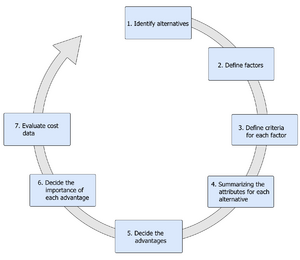
CBA as a tool can be done in seven steps, as followed: (1) Identify alternatives, (2) Define factors, (3) Define criteria for each actor, (4) Summarizing the attributes of each alternative, (5) Decide the advantages, (6) Decide the importance of each advantage and (7) evaluate cost data. These steps are shown in Figure 7. [12]
This tool process is eminently collaborative between stakeholders, designers and other disciplines. After finding the most suitable alternative, they can go on to the next phase of the CBA Tabular Method of reconsidering the decision. By using this tool, the stakeholders can ask questions like: Are there any additional alternatives to be considered for this project? Does the importance of advantages accurately represent the viewpoint of the stakeholders? [12]
[edit] Last Planner System
Last Planner System (LPS) as a tool was originally made as a solution for the inefficiency of the building industry and has over time evolved into a tool to control the workflow better. [13]. The system is regarding to the Lean Construction Institute, used for project production planning and control, and are aimed at creating a workflow that archives reliable execution [14]. LPS is a collaborative planning process in which are used when the teams are getting close to actually doing the work. It is done in a opposite way when compared to conventional principles. LPS are using “pull planning” principles, where the work that CAN and WILL be done is considered and promised by Last Planners themselves [15]. Principles of LPS regarding to LeanConstruction.org is:
- Plan in greater detail as you get closer to doing the work
- Produce plans collaboratively with those who will do the work
- Reveal and remove constraints on planned tasks as a team
- Make and secure reliable promises
[edit] References
- ↑ 1.0 1.1 Parsons, N. (2019, September 12). What Is a SWOT Analysis, and How to Do It Right (With Examples). Retrieved from https://www.liveplan.com/blog/what-is-a-swot-analysis-and-how-to-do-it-right-with-examples/
- ↑ Imai, M. (2012). Gemba kaizen: a commonsense approach to a continuous improvement strategy. New York: McGraw Hill.
- ↑ IRouse, M. (2019, November 7). What is a Fishbone Diagram (Ishikawa Cause and Effect Diagram)? Retrieved from https://whatis.techtarget.com/definition/fishbone-diagram
- ↑ Alyoubi, M., Alqahtani, J., & Aziz, A. A. (2017). Quality Improvement Methodologies – PDCA Cycle and Six Sigma in E-learning System. Iarjset, 4(5), 95–99.
- ↑ Shook. (2010). Managing to Learn. Cambridge, MA: Lean Enterprise Institute, Inc.
- ↑ Gupta, A. P., Tommelein, I. D. & Blume, K. (n.d.). Framework for using A3s to develop shared understanding on projects. International Group for Lean Construction.
- ↑ The College. (2007). The American Institute of Architects College of Fellows. Washington, D.C.
- ↑ What is a KPI? Definition, Best-Practices, and Examples. (2020). Retrieved 8 March 2020, from https://www.klipfolio.com/resources/articles/what-is-a-key-performance-indicator.
- ↑ KPI - Key Performance indicators - Center for Lean. (2020). Retrieved 8 March 2020, from https://centerforlean.dk/kpi/
- ↑ Alves, T., Lichting, W. and Rybkowski, Z. (2017). Implementing Target Value Design. “HERD: Health Environments Research & Design Journal”, 10(3), pp.18-29.
- ↑ Arroyo, P. (2020). Lean Construction Blog. Retrieved 8 March 2020, from https://leanconstructionblog.com/applying-choosing-by-advantages-step-by-step.html
- ↑ 12.0 12.1 Arroyo, P., Tommelein, I., & Ballard, G. (2013). Using "Choosing by Advantages" to select ceiling tile from a global sustainable perspective. Proceedings IGLC-21, 311.
- ↑ Ćwik, K., & Rosłon, J. (2017). Last planner system in construction. MATEC Web Of Conferences, 117, 00032. doi: 10.1051/matecconf/201711700032
- ↑ Lean Construction Institute (LCI) | Lean Project Design & Delivery. (2020). Retrieved 8 March 2020, from https://www.leanconstruction.org/
- ↑ (2020). Retrieved 8 March 2020, from https://www.leanconstruction.org/media/docs/chapterpdf/israel/Last_Planner_System_Business_Process_Standard_and_Guidelines.pdf
