The Gantt Chart
| Line 19: | Line 19: | ||
The purpose of the Gantt Chart is to present a chart that simple and quickly provides the viewer with the information needed to analyze the project and give an overview of the time span of the project, the time span of the different activities within the project and show the interdependencies of the activities. | The purpose of the Gantt Chart is to present a chart that simple and quickly provides the viewer with the information needed to analyze the project and give an overview of the time span of the project, the time span of the different activities within the project and show the interdependencies of the activities. | ||
| − | One of the most important things to remember about the Gantt Chart however is that, alone the Gantt Chart is a blunt instrument. It is used as a presentation of future plans but the Gantt Chart itself does not cover '''why''' of the planning. | + | One of the most important things to remember about the Gantt Chart however is that, alone the Gantt Chart is a blunt instrument. It is used as a presentation of future plans but the Gantt Chart itself does not cover '''why''' of the planning. A project director of a large construction company has also commented that: "I believe that computer-based project management has set the subject back 20 years". |
<ref>[''Beyond the Gantt Chart''] ''Maylor, Harvey (2001) "Beyond the Gantt Chart: Project Mangement Moving on", ''European Management Journal Vol. 19'' '' </ref> | <ref>[''Beyond the Gantt Chart''] ''Maylor, Harvey (2001) "Beyond the Gantt Chart: Project Mangement Moving on", ''European Management Journal Vol. 19'' '' </ref> | ||
| Line 26: | Line 26: | ||
==The use of a Gantt Chart in practise== | ==The use of a Gantt Chart in practise== | ||
| + | [[File:Basic_Gantt_Chart.gif|635px|thumb|left|Figure 1: Example of a basic Gantt Chart, Source: http://www.ganttchart.com/BasicGanttExample.html]] | ||
| + | [[File:Gantt Visio.png|630px|thumb|right|Figure 2: Example of a Gantt Chart created in Visio, Source: http://gioielleriaricci.it/gif/photos/index.php?p=26]] | ||
| + | In order to use a Gantt Chart one must have a detailed plan for the project. It is grucial that the duration of each activity within in the project has been estimated and that the interdependencies has been identified. Furthermore you need to know what resources are able to perform the activities as the same resource is not able to perform several activities at once. When the data is put into the Gantt Chart it should be easy to see the start and finish of all activities and the project, and you be able to easily get an idea of which activities are dependent on each other. One way to help get an overview of the activities is through color coding. | ||
| + | '''Figure 1''' illustrates the use of a simple Gantt Chart from a Security & Access Control project. As it can bee seen in the figure, all activities are marked with a yellow triangle and a number to indicate the start date of the activity. Each activity is also marked with a green triangle and a number to indicate the planned end date of the activity. In the left column the name of each activity is written and in the right column the responsible sub contractor for each activity is listed. | ||
| + | '''Figure 2''' is an example of how a Gantt Chart looks in Micosoft Visio which is a program that should be available for free for students at DTU. In this example it is very fast to see how long each activity takes and the planned start and end date for each activity. | ||
| Line 33: | Line 38: | ||
| + | |||
| + | |||
| + | '''critical path'''. The critical path is the longest sequence of tasks that has to be completed in time for the project to be finished on the due date, or said in another way, it is the sequence of tasks that determines the earliest possible completion date of the project. | ||
==Limitations== | ==Limitations== | ||
Revision as of 09:05, 21 September 2015
This article will introduce the Gantt Chart by giving a basic introduction to the understanding of the Gantt Chart, providing a simple example of the use of a Gantt Chart as well as pointing out some of the limitations. The Gantt Chart was the first time created by a Polish engineer named Karol Adamiecki (born March 18th 1866) but was later also created independantly by an american engineer called Henry Gantt (born in 1861). It is a tool that is very commonly used in project management as it is great for displaying different activities against time. Depending on how much information you put into the Gantt Chart the Gantt Chart can become increasingly complex to use. Because of todays technology it has become much easier to create a Gantt Chart and get an overview of the interdependencies of the different activities within a project as many different computer programs can help to create a Gantt Chart fast and easy.
It can however be very confusing to create a Gantt Chart by using different computer programs as there are a lot of different informations that can be put into a Gantt Chart. So choosing the right program compared to how detailed you want it to be can be a hard choice.
Contents |
History of the Gantt Chart
The first version of the Gantt Chartt was created in the mid 1890's by the Polish engineer named Karol Adamiecki who was born on March 18th 1866. The world known version that we know today was developed approximately 15 years later than the first version, by an American engineer and consultant called Henry Gantt who was born in 1861. This version of the Gantt Chart was created by Henry Gantt while he was working with the construction of Navy ships during World War One and it became very polular which is why it is known today as "the Gantt Chart". In the beginning the Gantt Charts were created by hand which caused a lot of re-work when a change in the current planning happened. Today we have the technology advantage of computers and a lot of different project managing software to help create a Gantt Chart which can be updated a lot easier than back in the days where it had to be done with a pen.
Basic understanding
The Gantt Chart is a type of bar chart where the bars are represented in relation to a x-axis and a y-axis. The x-axis represents the time which can be hours, days, weeks, months etc. depending on the timespan of the project. The y-axis represents the number of different activities or tasks that has to be performed in the project. The bars in the chart each represents an activity and the length of the bar is dependent on the amount of time estimated for that specific activity. The different activities can be dependent on one another which means that one activity may not begin before another activity has finished. This does not mean that multiple activities can not be worked on at the same time it merely means that some activities might be connected.
An example could be a project where you need to turn on the light. It is not possible to turn on the light before a lamp has been purchased and installed so using the switch will have to wait until the lamp has been installed. If you need to buy a light bulb this can be done in advance if you know what type you need otherwise this task would have to wait until the lamp has been purchased but it would be possible to buy the light bulb before the lamp has been installed.
There is also the case where an activity can begin after a certain oercentage of its predecessor activity has been completed. A situation could also arise where an activity has been completed but it is pending an approval or similar which results in the next activity not being able to start. This is called dependency with lag time.
The purpose of the Gantt Chart is to present a chart that simple and quickly provides the viewer with the information needed to analyze the project and give an overview of the time span of the project, the time span of the different activities within the project and show the interdependencies of the activities.
One of the most important things to remember about the Gantt Chart however is that, alone the Gantt Chart is a blunt instrument. It is used as a presentation of future plans but the Gantt Chart itself does not cover why of the planning. A project director of a large construction company has also commented that: "I believe that computer-based project management has set the subject back 20 years". [1]
The use of a Gantt Chart in practise


In order to use a Gantt Chart one must have a detailed plan for the project. It is grucial that the duration of each activity within in the project has been estimated and that the interdependencies has been identified. Furthermore you need to know what resources are able to perform the activities as the same resource is not able to perform several activities at once. When the data is put into the Gantt Chart it should be easy to see the start and finish of all activities and the project, and you be able to easily get an idea of which activities are dependent on each other. One way to help get an overview of the activities is through color coding.
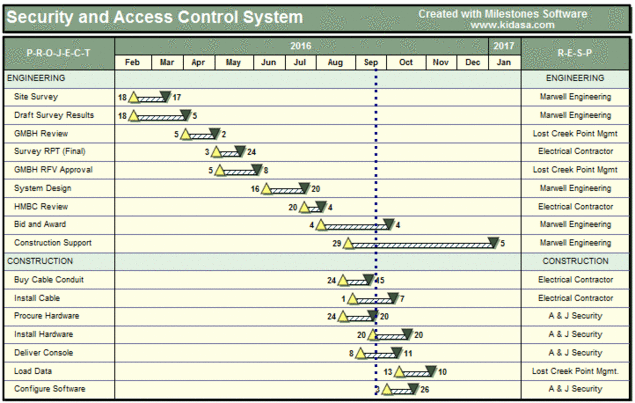
Figure 1 illustrates the use of a simple Gantt Chart from a Security & Access Control project. As it can bee seen in the figure, all activities are marked with a yellow triangle and a number to indicate the start date of the activity. Each activity is also marked with a green triangle and a number to indicate the planned end date of the activity. In the left column the name of each activity is written and in the right column the responsible sub contractor for each activity is listed.
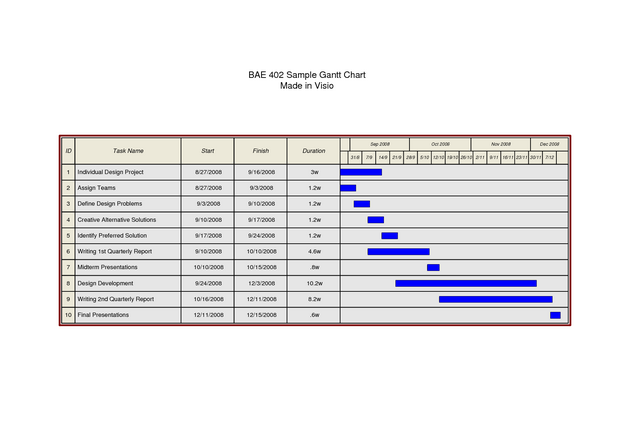
Figure 2 is an example of how a Gantt Chart looks in Micosoft Visio which is a program that should be available for free for students at DTU. In this example it is very fast to see how long each activity takes and the planned start and end date for each activity.
critical path. The critical path is the longest sequence of tasks that has to be completed in time for the project to be finished on the due date, or said in another way, it is the sequence of tasks that determines the earliest possible completion date of the project.
Limitations
Tools for creating Gantt Charts
Free to use (for DTU students)
Microsoft Visio - One of the easier tools to use if you need a simple Gantt Chart, which should be available from Microsoft Dreamspark for students at DTU. [2]
Pay to use
Conclusion
Annotated Bibliography
References
- ↑ [Beyond the Gantt Chart] Maylor, Harvey (2001) "Beyond the Gantt Chart: Project Mangement Moving on", European Management Journal Vol. 19
- ↑ [www.dreamspark.com] https://www.dreamspark.com/