Sankey Diagram
From DTU ProjectLab
(Difference between revisions)
| Line 1: | Line 1: | ||
Sankey diagrams are a graphical way of visualizing the flow of resources in a team, project, process, company, etc. Resources mapped in a Sankey diagram can be anything from materials, monetary funds, people allocation, etc. | Sankey diagrams are a graphical way of visualizing the flow of resources in a team, project, process, company, etc. Resources mapped in a Sankey diagram can be anything from materials, monetary funds, people allocation, etc. | ||
| + | |||
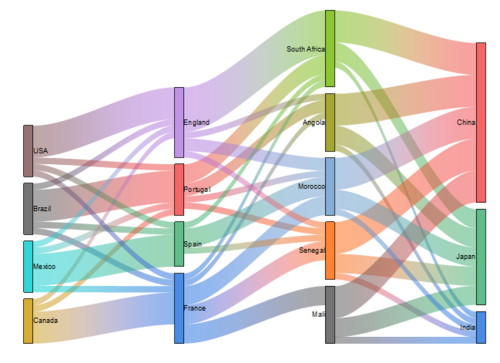
[[File:Sankey_Diagrams_01.png|500px|thumb|right|Sankey diagram of flow of information between countries][https://www.originlab.com/doc/Origin-Help/Sankey-Diagram]] | [[File:Sankey_Diagrams_01.png|500px|thumb|right|Sankey diagram of flow of information between countries][https://www.originlab.com/doc/Origin-Help/Sankey-Diagram]] | ||
Revision as of 19:34, 12 February 2022
Sankey diagrams are a graphical way of visualizing the flow of resources in a team, project, process, company, etc. Resources mapped in a Sankey diagram can be anything from materials, monetary funds, people allocation, etc.

Sankey diagram of flow of information between countries][https://www.originlab.com/doc/Origin-Help/Sankey-Diagram