Effective Communication in Project Management
| Line 21: | Line 21: | ||
Information could be communicated also by draw, pictures, charts or graphs. | Information could be communicated also by draw, pictures, charts or graphs. | ||
Example of visual communication is a great tool that is utilized by many different project management, agile and even Six Sigma disciplines is the Ishikawa or fishbone diagram. An Ishikawa diagram is used to ensure that a balanced list of ideas is generated during brainstorming or that major possible causes were not overlooked. Given its simplicity, it is easy to see why it has gained acceptance across so many disciplines. It also only takes a pen and paper (or whiteboard and marker) to get started, and it can be used during any phase of a project. Brainstorming, root-cause analysis, documenting a process flow’s inputs/outputs and the possible scenarios where it can be used makes this an indispensable tool for all team members. It should be used on a regular basis when communicating ideas or issues and is a prime example of the power of visual communication. | Example of visual communication is a great tool that is utilized by many different project management, agile and even Six Sigma disciplines is the Ishikawa or fishbone diagram. An Ishikawa diagram is used to ensure that a balanced list of ideas is generated during brainstorming or that major possible causes were not overlooked. Given its simplicity, it is easy to see why it has gained acceptance across so many disciplines. It also only takes a pen and paper (or whiteboard and marker) to get started, and it can be used during any phase of a project. Brainstorming, root-cause analysis, documenting a process flow’s inputs/outputs and the possible scenarios where it can be used makes this an indispensable tool for all team members. It should be used on a regular basis when communicating ideas or issues and is a prime example of the power of visual communication. | ||
| − | + | ||
| + | These techniques aim to get at the root causes of a problem and not just the symptoms. | ||
| + | Kaoru Ishikawa,a Japanese Quality pioneer, introduced a very visual ‘Fishbone’ diagram that helps a whole team focus on this and get rapidly to consensus. | ||
| + | This diagram: | ||
| + | |||
| + | •Resembles the skeleton of a fish | ||
| + | |||
| + | •Focus on causes rather than symptoms of a problem | ||
| + | |||
| + | •Emphasizes group communication and brainstorming | ||
| + | |||
| + | •Stimulates discussion | ||
| + | |||
| + | The first step is to get clarity and consensus on what the problem is to get a focused problem statement. A problem might be stated originally as ‘customers complain of | ||
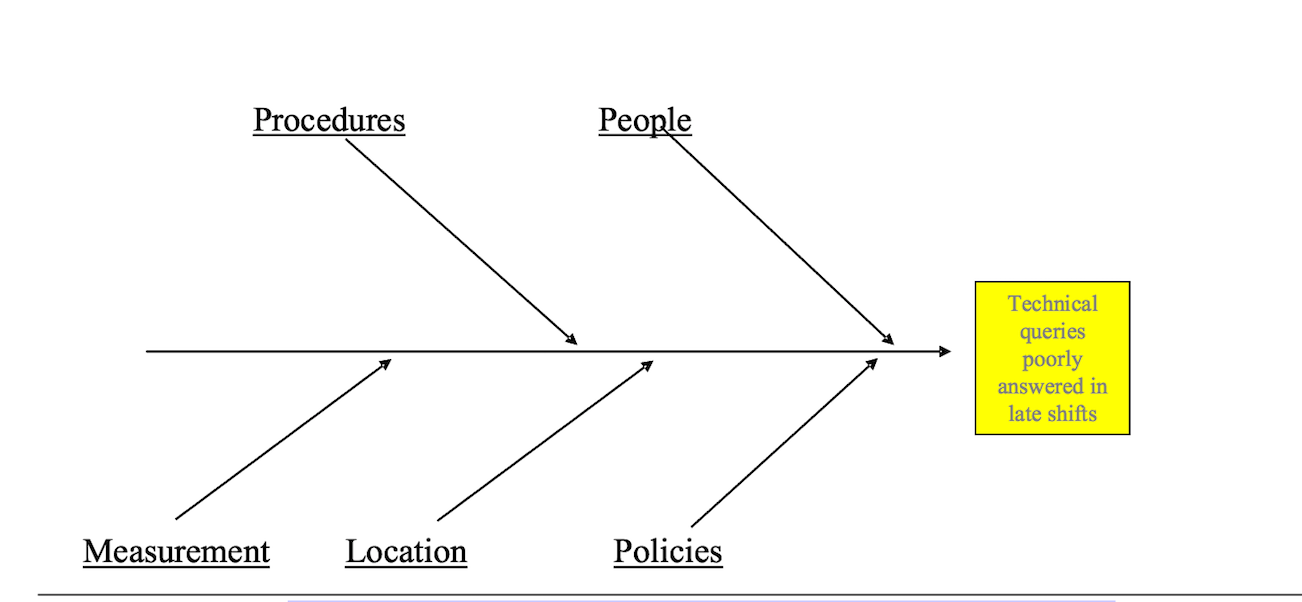
| + | poor service. After discussion, this might be refined to ‘Poor resolution of technical queries on evenings and weekends’. This tighter statement helps focus the task of getting to the root cause of the problem. This problem statement is put at the ‘head’ of the fish, along with the fish’s backbone: | ||
| + | |||
| + | [[image:FISHBON.png]] | ||
| + | |||
| + | The next step is to brainstorm potential causes of the problem. This may be augmented by prior research by the team, using metrics and statistical analysis if appropriate. The major types of cause are then laid out as large bones connected to the backbone. Either of two alternative approaches should be used: | ||
| + | |||
| + | •Categories of causes: | ||
| + | |||
| + | oFor a production/manufacturing process, these usually are People, | ||
| + | Materials, Machinery/Equipment, Methods, Environment and | ||
| + | Measurement. | ||
| + | |||
| + | oFor a service process, they are often People, Policies, Procedures (the flow | ||
| + | of the process), Location (Equipment/Space) and Measurement. | ||
| + | |||
| + | •Process steps: the major process steps are used. | ||
| + | |||
| + | The key is to be flexible and use the category type and categories themselves most | ||
| + | appropriate to the problem in hand, based on the causes surfaced from the brainstorm. | ||
| + | |||
| + | |||
== Effective Communication == | == Effective Communication == | ||
Revision as of 15:56, 25 September 2015
The word communication will be used here in a very broad sense to include all of the procedures by which one mind may affect another. This, of course involves not only written and oral speech, but also music, pictorial arts, the theatre, the ballet and in fact all human behaviour. In some connections it may be desirable to use a still broader definition of communication, namely, one which would include the procedures by means of which one mechanism (say automatic equipment to track an airplane and to compute its probable future positions) affects another mechanism (say a guided missile chasing this airplane).
Warren W. Weaver [1]
Contents |
Communication in Project Management
Communication is one of the most important part of project management. Working on a project there must be a good communication between who is planning the work and who is working on it. A successful project manager must be a great communicator. Doing the same things with the same people in the same place is never possible because the projects are always different, and for these reasons every project needs the best way to communicate between manager and workers.
Hence, employing effective communication methods are necessary to ensure project success
Methods of Communication
Verbal Communication
Nonverbal Communication
Visual Communication
Visual communication is one of the methods used to communicate information or expression of ideas through a visual form. Information could be communicated also by draw, pictures, charts or graphs. Example of visual communication is a great tool that is utilized by many different project management, agile and even Six Sigma disciplines is the Ishikawa or fishbone diagram. An Ishikawa diagram is used to ensure that a balanced list of ideas is generated during brainstorming or that major possible causes were not overlooked. Given its simplicity, it is easy to see why it has gained acceptance across so many disciplines. It also only takes a pen and paper (or whiteboard and marker) to get started, and it can be used during any phase of a project. Brainstorming, root-cause analysis, documenting a process flow’s inputs/outputs and the possible scenarios where it can be used makes this an indispensable tool for all team members. It should be used on a regular basis when communicating ideas or issues and is a prime example of the power of visual communication.
These techniques aim to get at the root causes of a problem and not just the symptoms. Kaoru Ishikawa,a Japanese Quality pioneer, introduced a very visual ‘Fishbone’ diagram that helps a whole team focus on this and get rapidly to consensus. This diagram:
•Resembles the skeleton of a fish
•Focus on causes rather than symptoms of a problem
•Emphasizes group communication and brainstorming
•Stimulates discussion
The first step is to get clarity and consensus on what the problem is to get a focused problem statement. A problem might be stated originally as ‘customers complain of poor service. After discussion, this might be refined to ‘Poor resolution of technical queries on evenings and weekends’. This tighter statement helps focus the task of getting to the root cause of the problem. This problem statement is put at the ‘head’ of the fish, along with the fish’s backbone:
The next step is to brainstorm potential causes of the problem. This may be augmented by prior research by the team, using metrics and statistical analysis if appropriate. The major types of cause are then laid out as large bones connected to the backbone. Either of two alternative approaches should be used:
•Categories of causes:
oFor a production/manufacturing process, these usually are People, Materials, Machinery/Equipment, Methods, Environment and Measurement.
oFor a service process, they are often People, Policies, Procedures (the flow of the process), Location (Equipment/Space) and Measurement.
•Process steps: the major process steps are used.
The key is to be flexible and use the category type and categories themselves most appropriate to the problem in hand, based on the causes surfaced from the brainstorm.
Effective Communication
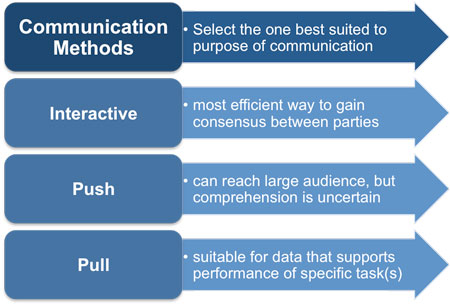
The project manager decides, based on communication requirements, what, how, and when communication methods are to be used in the project. This process requires discussion and dialogue with the project team to determine the most appropriate way to update and communicate project information, and to respond to requests from various stakeholders for that information. [2]
Interactive Communication
An interactive communication is required when the communication is likely to be misinterpreted. Every stakeholder can respond to each other in real time
Push Communication
This type of communication is used from sender to receiver. It is preferable when the sender sends information and do not want an immediate response from receiver or when the information do not need immediate response because is not pressing or as important. Examples of Push Communication are : emails, letter, reports or faxes. It is not a face-to-face communication but always an information through a written medium.
Take, for example, you have a technical issue that demands immediate attention, and you alert the Tech department of your company to fix it. You send the Tech guy a mail. He isn't available for the day and is therefore not able to receive and attend to your mail. You only know that the mail you wrote has been successfully sent. You do not know if he has received it or not. You will only know that he has when he comes and fixes our problem that will be the next day. [2]
Pull Communication
This type of communication is used from sender to a large audience. All members that want to have information can access to in through a common way. Example of Pull Communication are post on websites, Podcasts, blogs, exc. The reicever has to recover this information.
A sample-case scenario would be when you have enrolled for a project management course and need access to more inputs on your course, and you begin to search for relevant information from the Articles/Ebooks that is available on the training provider’s site itself.[3]
Limitations
Conclusion
References
[1]Weaver, Warren: Recent Contributions to the Mathematical Theory of Communication (1949) , http://www.panarchy.org/weaver/communication.html
[2]http://www.free-management-ebooks.com/faqpm/team-07.htm
[3]http://www.simplilearn.com/interactive-vs-push-vs-pull-communication-in-project-management-article

