The A3 report
| Line 217: | Line 217: | ||
| − | == | + | == Discussion and implementation advice == |
The A3 report is not a fixed setup meaning that they should be created to fit the specific situation and environment which they are used for. This section will provide an overview of the different elements of content within each of the three standard A3 report templates described above as well as discussing the differences. | The A3 report is not a fixed setup meaning that they should be created to fit the specific situation and environment which they are used for. This section will provide an overview of the different elements of content within each of the three standard A3 report templates described above as well as discussing the differences. | ||
| Line 239: | Line 239: | ||
= Application example: project/portfolio management = | = Application example: project/portfolio management = | ||
| − | As stated previously in the article the A3 report can be used in various variants and combinations for different purposes. This article will present an example and suggestion of how to draw on the benefits from the A3 report within portfolio management. | + | As stated previously in the article the A3 report can be used in various variants and combinations for different purposes. This article will present an example and suggestion of how to draw on the benefits from the A3 report within project and portfolio management. In order to describe how the A3 report can be implemented in portfolio management, a short description of portfolio management is provided. |
| − | Portfolio management | + | A company's portfolio is the total investment in changes required to achieve strategic objectives. Portfolio management is the coordination of decisions and processes that |
| + | |||
| + | Portfolio management has to create an overview of the relations between sub portofolios, programs and projects as well as managing resources according to organizational priorities<ref name=(PMI, 2013)>''Standard for Portfolio Management (3rd Edition). Project Management Institute, Inc. (PMI) (2013)'' </ref>. The above listed elements are all part of the overall portfolio. | ||
| + | |||
| + | proposal A3 forholder sig til company goals | ||
| Line 249: | Line 253: | ||
| − | |||
| − | |||
= References = | = References = | ||
<references /> | <references /> | ||
Revision as of 21:14, 24 November 2014
Contents |
Abstract
The A3 report is a widely used LEAN-tool which derives from Toyota's production system. It is used in various industries and has a range of different applications. Most commonly the A3 report is used as a tool for problem-solving, communication, knowledge-sharing etc. in organisations. This article will describe the origin of the A3 report and the different types of A3 reports. An overview of the different elements in the A3 reports in combination with a stepwise description of the use is provided. Furthermore it will be described how to choose and customize one or more A3 reports for portfolio management as well as implementation advice.
This article breaks down the content elements in the different A3 and provides a basis for customization to a specific need.
Introduction
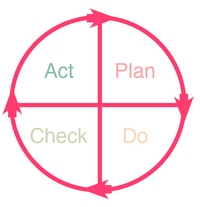
The name of the "A3 report" refers to the standard size A3-paper on which it fits. The idea behind the tool was developed by Toyota and was used from the 1960’s. It became a part of the Toyota Production System as a standard for problem solving, proposals, plans and status reviews. The A3 report is evolved around a Plan-Do-Check-Act (PDCA) cycle developed by Walter Shewhart. The PDCA system is a way of continuously improving and managing an organization in a systematic way. The A3 documents the findings from the PDCA cycle but is very flexible to the problem for which it is used to analyze.[1] The A3 describes in principal the chronologically story of the PDCA in one or more A3’s by step wise going through the different stages of the PDCA. For this reason the A3 report has been referred to as “Standardised storytelling”.[2] Even though the tool origins and is widely used in manufacturing, it has been applied successfully in a range of industries such as healthcare, for educational purposes, aircraft maintenance[1] as well as construction[3].
A3 report templates
Today the A3 report is a common LEAN tool used as a part of LEAN management. The A3 report has developed into several variations as specific tools for problem solving, innovating, planning as well as a general thinking within all levels of an organization. This has lead to the A3 report not only being a problem-solving tool but a tool that facilitates the A3-thinking in different ways. Common for the different types of A3 reports is that they follow the PDCA cycle[4]. This section provides and overview of the different types of A3’s, recommended content and templates. In general it is recommended to use a high level of facts and figures in a simple way which is easily read and understand[4].
The problem-solving A3 report
This A3 report is the most common type of A3 report.
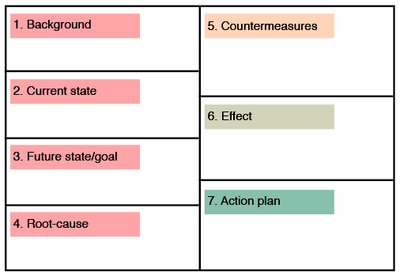
Description of steps The problem-solving A3 report consists overall of the elements covering each of the phases in the PDCA cycle.
Plan
A description of the problem, background and context that provides an understanding of the root causes of the problem[2]. This phase usually takes up the left half of the A3 report.
1. Background
This section describes the extend and importance of the problem.
2. Current state
This section describes the current situation within the company in relation to the problem.
3. Future state/goal
The goals for the future state is described in this section.
4. Root-cause analysis
The root-cause of the problem describes what needs to be solved in order to achieve the goal. There are several ways to analyse the root cause:
- The Toyota way: asking why five times or until the root-cause is found
- The Ishikawa “fishbone diagram”
- The reality tree
Do
5. Countermeasures
In this section different countermeasures for hypotheses are described and tested by changing and adjusting different parameters. Testing and exploration of the many different countermeasures creates a more thought through basis for choosing the best solution. The countermeasures should solve the gap between current state and the desired future state.
Check
6. Effect
Studies the effect of the “Do” phase. It discusses the success and failure of the implemented countermeasures. The “Check” section of the A3-report is in some templates integrated in the “Do” section[2] and in other templates it is a seperate section[1].
Act
7. Action plan
In this phase an action plan is created to solve the long-term problem. It is analysed if standardization should be implemented based on a positive outcome from the countermeasures. The action plan can be made in different ways e.g. as a list of actions[1] or an actual project plan with timelines[2]. If the countermeasures were not beneficial the PDCA cycle can be repeated as an iterative process.
The proposal A3 report
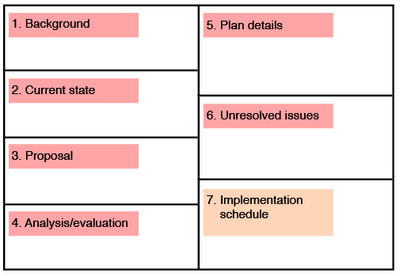
This type of A3-report has the purpose of creating a proposal to the organization. This means that it isn’t necessarily a problem that the A3 owner wants to address but it might be an opportunity. Furthermore the emphasis of this type of A3 is placed on the planning-phase.
Plan
1. Background
This section describes the extent and importance of the problem or opportunity. It should be described how the opportunity relates to the goals and value of the company[4].
2. Current state
This section describes the current situation within the company in relation to the problem or opportunity.
3. Analysis/evaluation of alternatives
This section is highly dependent on the type of proposal and if it’s a problem or an opportunity. If the A3 report describes a proposal of a future state this step might be irrelevant.
4. Proposal
This section should describe the a concise proposal statement and an analysis of what is achieved including savings in terms of cost and time.
5. Plan details
The details of the implementation are described in this section. This can include a list of actions in order to achieve the proposal.
6. Unresolved issues (optional)
This section functions as a “parking lot” for issues that should be addressed in relation to the proposal but for various reasons are out of scope of the project.
Do, check, act
7. Implementation schedule
Similar to the problem-solving A3 the proposal A3 contains a detailed timeline describing execution.
The status A3 report
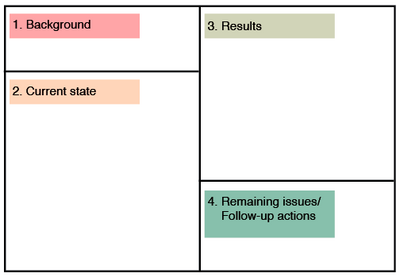
This type of A3 report reviews the project and can be used at various points in time during a project as well as provide an end status[4].
Plan
1. Background
This section describes the extent and importance of the problem or opportunity. For the status A3 this section has a high dependency on who the receiver of the review is and the knowledge of this person.
Do
2. Current state
The current state describes the new state after actions have been taken or a summary of the changes. The current state could be described by using a Gantt Chart[4].
Check
3. Results
This section describes the obtained results from the actions taken at the point in time. Often this section related to metrics such as quality, cost and time.
Act
4. Remaining issues/follow-up actions
Describes the steps necessary to accomplish the goal of the project.
Discussion and implementation advice
The A3 report is not a fixed setup meaning that they should be created to fit the specific situation and environment which they are used for. This section will provide an overview of the different elements of content within each of the three standard A3 report templates described above as well as discussing the differences.
Focus and application
The figure shows each element within the specific type of A3 report. The colorcodes describe which of the phases in the PDCA cycle the element belongs to.
The problem-solving A3 report is the original A3 report and origins from a manufacturing environment as described previously in the article. For this reason this type of A3 report has a strong focus on problems related to delivery, productivity, cost and safety[4]. This is shown in the root-cause analysis which can be executed in several ways and where the aim is to get to the bottom of the problem. Furthermore there is a strong focus on solving the problem short term with countermeasures as well as long term with follow-up actions. From figure 5 it is seen that the planning phase takes up a great part of the content within the problem-solving A3 report which includes the root-cause analysis. In general the problem-solving A3 is objective, data-driven, focused on finding root-causes and solving them on a short- and long-term basis.
On the other hand there is the proposal A3 report which adresses opportunities and focuses on improving the current state. This type of A3 often deals with larger investments or use of ressources. Therefore a great emphasis is placed on the planning phase which takes up most of the A3 report. The planning phase decribes in detail what can be improved, how the improvement is actually carried out and what the expected benefits are. It has to convince the receiver that this is a good idea.
The status A3 report is also based on the PDCA cycle but is another type of tool than the other A3 reports. This tyoe if A3 a tool effectively communicates a status of a project, actions etc. This is reflected in the A3 content, which only contains four basic elements. It can be used in continuation of the two other A3 reports after actions have been taken. This A3 therefore serves another need than the two described previously.
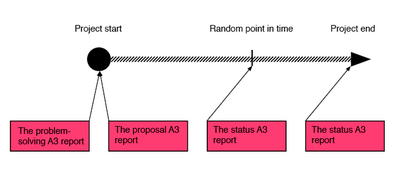
The three types of A3's shouldn't replace each other since they are adressing different aspects and situations within an organization. Figure 6 shows how the three different A3 report templates can be used in various steps of a project. The Problem-solving A3 report can be used to start up and project due to the long-term problem-solving part. This also applies to the proposal A3 report since it is often a suggestion to start up a new improvement project. The status A3 report can be used as often as desired during a project to provide status updates to stakeholders.The three A3 reports can, however, be combined and customized so they fit the needs of the user and receiver.Users and requirements
The A3 problem-solving report can be used even with a minimal knowledge of the processes within the organization. It is valuable to have inputs from several people when it comes to this type of A3 because different angles on how the problem has occured will increase the chance of getting it right and not overlooking some aspects. There should, however, not be an endless group of people. The proposal A3 report requires the employees to have a deeper understanding of the processes within the organizationen in order to come up with
Application example: project/portfolio management
As stated previously in the article the A3 report can be used in various variants and combinations for different purposes. This article will present an example and suggestion of how to draw on the benefits from the A3 report within project and portfolio management. In order to describe how the A3 report can be implemented in portfolio management, a short description of portfolio management is provided.
A company's portfolio is the total investment in changes required to achieve strategic objectives. Portfolio management is the coordination of decisions and processes that
Portfolio management has to create an overview of the relations between sub portofolios, programs and projects as well as managing resources according to organizational priorities[5]. The above listed elements are all part of the overall portfolio.
proposal A3 forholder sig til company goals
Processes and deliverables used by operations management are often outputs of the portfolio components. Therefore, the portfolio manager must manage relationships and interfaces with operations effectively if the full value of each portfolio component is to be realized.
References
- ↑ 1.0 1.1 1.2 1.3 Schwagerman III, W. C., & Ulmer, J. M. (2013). The A3 Lean Management and Leadership Thought Process. Journal of Technology, Management & Applied Engineering, 29(4).
- ↑ 2.0 2.1 2.2 2.3 Shook, J. (2009). Toyota's secret: the A3 report. MIT Sloan management review, 50(4), 30-33.
- ↑ Ko, C. H., & Tsai, P. C. (2013). Applying Lean Production A3 to Enhance Construction Work Flow. Life Science Journal, 10(2).
- ↑ 4.0 4.1 4.2 4.3 4.4 4.5 Sobek II, D. K., & Smalley, A. (2011). Understanding A3 thinking: a critical component of Toyota's PDCA management system. CRC Press.
- ↑ Standard for Portfolio Management (3rd Edition). Project Management Institute, Inc. (PMI) (2013)
