Understand best practices based on network mapping
(→Best Practices) |
|||
| Line 15: | Line 15: | ||
| − | == | + | ==Methodology: Network visualization and analysis== |
| − | + | ||
| − | + | ||
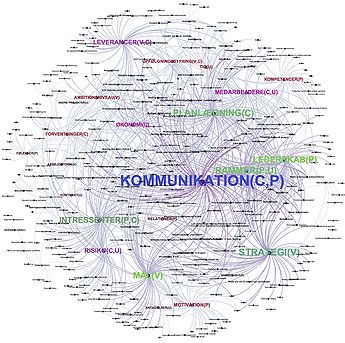
| + | Network visualization has its origin from social studies which the latest years has had a growth in the studies of complex connectedness of modern society. Network perspectives are used to simplify the complex network in models which helps diagnose possible issues and prevent potential problems. Furthermore network mapping reveals unknown relationships between objects in the networks. | ||
| − | + | A network consist of objects, which in network theory is called nodes.These nodes may be connected, but not all nodes in a network are. The connections between nodes in the network is called edges or links. These edges describe the relationship between the objects and depended on how these edges are drawn, the edges can have different meanings in the network. | |
| + | The total network which is all edges and nodes, is in network theory called a graph. This graph can have different meanings and can be visualized differently even though the graph contains the same set of edges and nodes. A graph usually shapes from definitions defined by oneself. It can be shaped dependent on a set of factors which can be connectivity, modularity, centrality, network size etc. These factors are some of the key features, to look at, when you try to analyse and understand complex networks. | ||
| + | A few of these key features will be listed below with short definitions. | ||
| − | + | Network size: Network size can be defined as the total number of nodes in the network. | |
| − | + | Connectivity: If all nodes in a network are connected and can reach to all nodes in the network by a path, the network can be defined as connected. | |
| − | + | Cluster: This is a set of nodes that are strongly connected in the network and placed close to each other. | |
| + | Distance: Is defined as the number of nodes you have to get passed to reach to another node, by that path length. | ||
| − | + | Centrality: This is defined as a group of nodes or individual nodes which has a strong influence and importance for the network. | |
| − | + | Degree centrality: The node with the highest number of edges connected directly to it. | |
| − | + | ||
| + | All these key features can be used to analyse and understand complex networks, in all kind of studies and can be applied when it comes to the study of project management | ||
==Network visualisation== | ==Network visualisation== | ||
== Best practices based on network mapping== | == Best practices based on network mapping== | ||
Revision as of 19:54, 26 September 2016
Contents |
Abstract
Project management has grown, from something that some companies uses to some extend when they operate their businesses, to something that all company uses. But as it is a growing business model to use, companies seems to to find the best way to manage projects to be challenging. Project can be small, simple and unpaid projects to big, complex and expensive projects. But even though all kind of materials exists on what the best techniques, process and methods for project management are, project management are still difficult to manage. This wiki will describe how project management practices can be visualised as a network and how network mapping can be used to determine “best practices of project management”. By analysing a groups of danish project managers and their choices of tools when they practice project management shows that some
Methodology: Network visualization and analysis
Network visualization has its origin from social studies which the latest years has had a growth in the studies of complex connectedness of modern society. Network perspectives are used to simplify the complex network in models which helps diagnose possible issues and prevent potential problems. Furthermore network mapping reveals unknown relationships between objects in the networks.
A network consist of objects, which in network theory is called nodes.These nodes may be connected, but not all nodes in a network are. The connections between nodes in the network is called edges or links. These edges describe the relationship between the objects and depended on how these edges are drawn, the edges can have different meanings in the network. The total network which is all edges and nodes, is in network theory called a graph. This graph can have different meanings and can be visualized differently even though the graph contains the same set of edges and nodes. A graph usually shapes from definitions defined by oneself. It can be shaped dependent on a set of factors which can be connectivity, modularity, centrality, network size etc. These factors are some of the key features, to look at, when you try to analyse and understand complex networks. A few of these key features will be listed below with short definitions.
Network size: Network size can be defined as the total number of nodes in the network.
Connectivity: If all nodes in a network are connected and can reach to all nodes in the network by a path, the network can be defined as connected.
Cluster: This is a set of nodes that are strongly connected in the network and placed close to each other.
Distance: Is defined as the number of nodes you have to get passed to reach to another node, by that path length.
Centrality: This is defined as a group of nodes or individual nodes which has a strong influence and importance for the network.
Degree centrality: The node with the highest number of edges connected directly to it.
All these key features can be used to analyse and understand complex networks, in all kind of studies and can be applied when it comes to the study of project management

