Value stream mapping in construction management
| Line 17: | Line 17: | ||
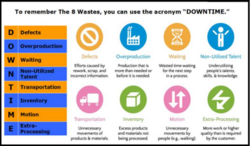
[[File:8 wastes.PNG|250px|thumb|right|Figure 2: 8 types of waste<ref name="8_waste_types">http://c.ymcdn.com/sites/www.nasfa.net/resource/resmgr/Learning_Series/Intro_to_Lean_Construction_&.pdf</ref>]] | [[File:8 wastes.PNG|250px|thumb|right|Figure 2: 8 types of waste<ref name="8_waste_types">http://c.ymcdn.com/sites/www.nasfa.net/resource/resmgr/Learning_Series/Intro_to_Lean_Construction_&.pdf</ref>]] | ||
| + | The following table list the 8 types of waste, typically found within the construction industry. | ||
{| class="wikitable" | {| class="wikitable" | ||
|- | |- | ||
| − | ! ''' | + | ! '''Waste type ''' |
| − | ! ''' | + | ! '''Definition/cause''' |
| − | + | ||
|- | |- | ||
| − | | ''' | + | | '''Defects''' |
| − | + | | Efforts caused by rework, scrap, and incorrect information. | |
| − | | | + | |
| − | + | ||
| − | + | ||
| − | + | ||
| − | + | ||
| − | + | ||
|- | |- | ||
| − | | | + | | '''Overproduction''' |
| − | | | + | | Production that is more than needed or before it is needed. |
| − | + | ||
| − | + | ||
|- | |- | ||
| − | | ''' | + | | '''Waiting''' |
| − | + | | Wasted time waiting for the next step in a process. | |
| − | + | ||
| − | + | ||
| − | + | ||
|- | |- | ||
| − | | | + | | '''Non-Utilized Talent''' |
| − | | - | + | | Under-utilizing peoples talents, skills and knowledge. |
| − | + | ||
| − | + | ||
|- | |- | ||
| − | | | + | | '''Transportation ''' |
| − | | | + | | Unnecessary movements of products and materials. |
| − | + | ||
| − | + | ||
| − | + | ||
| − | + | ||
|- | |- | ||
| − | | | + | | '''Inventory''' |
| − | | | + | | Excess products and material not being processed. |
| − | + | ||
| − | + | ||
|- | |- | ||
| − | | ''' | + | | '''Motion''' |
| − | + | | Unnecessary movements by people (e.g. walking). | |
| − | | | + | |
| − | + | ||
| − | + | ||
| − | + | ||
| − | + | ||
| − | + | ||
| − | + | ||
| − | + | ||
| − | + | ||
| − | + | ||
| − | + | ||
| − | + | ||
| − | + | ||
| − | + | ||
| − | + | ||
| − | + | ||
| − | + | ||
| − | + | ||
| − | + | ||
| − | + | ||
| − | + | ||
| − | + | ||
| − | + | ||
| − | + | ||
| − | + | ||
| − | + | ||
| − | + | ||
| − | + | ||
| − | + | ||
| − | + | ||
| − | + | ||
| − | + | ||
| − | + | ||
| − | + | ||
| − | + | ||
| − | + | ||
| − | + | ||
| − | + | ||
| − | + | ||
| − | + | ||
| − | + | ||
| − | + | ||
| − | + | ||
| − | + | ||
| − | + | ||
| − | + | ||
| − | + | ||
| − | + | ||
| − | + | ||
| − | + | ||
| − | + | ||
| − | + | ||
| − | + | ||
| − | + | ||
| − | + | ||
| − | + | ||
| − | + | ||
| − | + | ||
| − | + | ||
| − | + | ||
| − | + | ||
| − | + | ||
| − | + | ||
| − | + | ||
| − | + | ||
| − | + | ||
| − | + | ||
| − | + | ||
| − | + | ||
| − | + | ||
| − | + | ||
| − | + | ||
| − | + | ||
| − | + | ||
| − | + | ||
| − | + | ||
| − | + | ||
| − | + | ||
| − | + | ||
| − | + | ||
| − | + | ||
| − | + | ||
| − | + | ||
| − | + | ||
| − | + | ||
| − | + | ||
| − | + | ||
| − | + | ||
| − | + | ||
| − | + | ||
| − | + | ||
| − | + | ||
| − | + | ||
| − | + | ||
| − | + | ||
|- | |- | ||
| − | | | + | | '''Extra-Processing''' |
| − | + | | More work or higher quality than is required by the costumer. | |
| − | | | + | |
| − | + | ||
|- | |- | ||
| − | |||
| − | |||
| − | |||
| − | |||
|} | |} | ||
Revision as of 16:11, 12 June 2017
Value stream mapping (VSM) is a tool used within the field of Project Management to visualize and improve the overall flow process of a product or service from raw material all the way to the customer. It has its origin at TOYOTA, being a part of their lean management tools, where it is known as “material and information flow mapping”. VSM helps document all the activities required to complete a request from a customer. It includes people who normally manage individual functions or processes, and makes the overall flow of material and information across the entire process visible. In addition, it brings alignment to the organization, by involving the people who in fact do the work, and provides a platform for improvement and implementation. VSM is dynamic tool, since its continuously updated as the processes is being improved. VSM differs from the traditional tool; process/flow maps, by having a process focus, rather than a product focus. It provides a holistic view of how thing work, with a costumer perspective. One vital gain from applying VSM, is that it provides a common language when talking about processes, and allowing people to operate solely based on facts.
Contents |
The Big Idea
describe the tool, concept or theory and explain its purpose. The section should reflect the current state of the art on the topic
VSM generic formulation
Value stream mapping (VSM) originated in the manufacturing industry. It was developed by Toyota Motors Corporation, being a part of their Lean management tools. The Lean management philosophy is to identify and eliminate every activity in the design, production and supply chain management related processes that does not create value for a costumers point of view[1]. Generally it is characterized as a process-improving management philosophy, that seeks to minimize the waste without decreasing the productivity.
Value stream mapping (VSM) is used to both analyse and design the flow of material and information, that is required to bring a product or service to the end customer. It is a visual tool that provides a holistic view of the overall process, and thus a platform for strategically improvement and adding value to the costumers[2]. The goal is to design an “ideal state”, also known as the “future state” by analyzing the “current state”. The current state presents how the process is at the time of making the VSM, which is important due to its dynamic nature. The waste present within the work flow system, is identified by reflecting the current state. Having identified the wastes, a future state can be designed where the wastes are eliminated. VSM generates security within the organisations, which is essential to success. Insecurity often result in withhold of important information about the flow and processes, and will consequent lead to delay and loss of value.
VSM in the construction industry

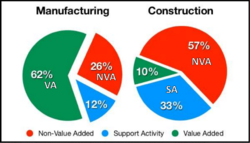
The construction industry in terms of productivity, quality and efficiency, is often characterized as a backward industry, that fails to innovate compared to other industries. The Lean Thinking philosophy was adopted to the construction industry since the 1970's, and several successful implementations has been achieved. The Construction Industry Institute states that only 10% are value added inputs and striking 57% are waste. This is compared to the manufacturing industry where 62% is value added and 26% is waste. The lack of performance in the construction industry compared to other industries, has been directly related to the low rate of innovation[2]. These statistics are a major motivation, for studying and identifying the wastage, which is frequently present in the industry. Consequently how to apply Lean tools and techniques to reduce the wastage. Examples of value adding activities are pouring concrete, erecting steel pr installing the roof. Examples of waste are excessive material handling, design errors, conflict between contractors, ineffective supply chain and rework.
8 types of waste

The following table list the 8 types of waste, typically found within the construction industry.
| Waste type | Definition/cause |
|---|---|
| Defects | Efforts caused by rework, scrap, and incorrect information. |
| Overproduction | Production that is more than needed or before it is needed. |
| Waiting | Wasted time waiting for the next step in a process. |
| Non-Utilized Talent | Under-utilizing peoples talents, skills and knowledge. |
| Transportation | Unnecessary movements of products and materials. |
| Inventory | Excess products and material not being processed. |
| Motion | Unnecessary movements by people (e.g. walking). |
| Extra-Processing | More work or higher quality than is required by the costumer. |
hello
dwa
Application
provide guidance on how to use the tool, concept or theory and when it is applicable
remember a image/list of all the symbols
pre cast concrete Yard example from the conference paper[1]
Limitations
critically reflect on the tool/concept/theory. When possible, substantiate your claims with literature
Annotated Bibliography
Provide key references (3-10), where a reader can find additional information on the subject. Summarize and outline the relevance of each reference to the topic. (around 100 words per reference). The bibliography is not counted in the suggested 3000 word target length of the article.
- ↑ 1.0 1.1 https://www.researchgate.net/publication/282156168_Implementing_Value_Stream_Mapping_Tool_in_the_Construction_Industry
- ↑ 2.0 2.1 http://oaktrust.library.tamu.edu/bitstream/handle/1969.1/156276/LI-THESIS-2015.pdf?sequence=1&isAllowed=y
- ↑ 3.0 3.1 http://c.ymcdn.com/sites/www.nasfa.net/resource/resmgr/Learning_Series/Intro_to_Lean_Construction_&.pdf