Risk identification
From DTU ProjectLab
(Difference between revisions)
(Created page with "=Risk identification - basic methods= ==Methods== ===Documentation review=== *Collect, review and understand the content of the relevant documents *Set focus on scope, cost,...") |
(→Diagramming techniques) |
||
| Line 32: | Line 32: | ||
*Cause and effect diagrams (fish-bone diagram): aids finding causes of the risks. | *Cause and effect diagrams (fish-bone diagram): aids finding causes of the risks. | ||
| − | + | [[File:Risk identification.png|frameless|center|1000px]] | |
(more: https://www.mindtools.com/pages/article/newTMC_03.htm) | (more: https://www.mindtools.com/pages/article/newTMC_03.htm) | ||
Revision as of 11:26, 13 August 2017
Contents |
Risk identification - basic methods
Methods
Documentation review
- Collect, review and understand the content of the relevant documents
- Set focus on scope, cost, time and quality.
- Identify assumptions and constraints, and review them.
- Review the quality of documentation based on completeness and consistency
Information gathering
- Brainstorming: Goal is to create a list of risks with the involvement of the project team, experts and stakeholders.
- Delphi technique: Experts participate anonymously in a questionnaire, the responses are summarized and results recalculated and the expert facilitator provides comments. Helps reduce bias in the data and prevents participants influencing each other.
- Interviews: experts, stakeholders, experienced project managers
Checklist and risk catalogues
- Risk identification checklists based on prior project’s data
- The lowest level of the risk breakdown structure can be used as a framework for te checklist
- It is impossible to build an exhaustive checklist
Assumption analysis
- Studies the validity of the assumptions present in the project.
- All assumptions should be explored and reviewed.
- Changes and new assumptions should be recorded
- Focus should be placed on assumptions that impact project objectives
Diagramming techniques
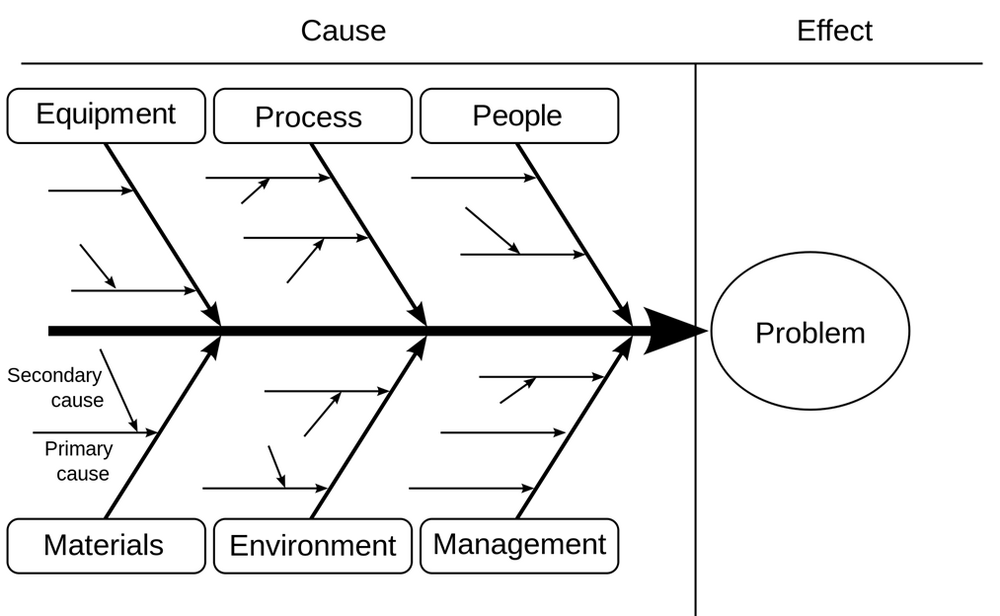
- Cause and effect diagrams (fish-bone diagram): aids finding causes of the risks.
(more: https://www.mindtools.com/pages/article/newTMC_03.htm)
- Root-cause analysis: reorganizing the identified risks by root causes can help unveil more risks.
- System or process flow charts: shows how elements in the project interrelate.
- Influence diagrams: represents causal influences among project variables, timing and the relationship among project variables and outcomes
