Decision tree
(→Decision tree for one risk) |
(→Decision tree for one risk) |
||
| Line 146: | Line 146: | ||
To determine which risk response is most cost/beneficial in terms of probability and costs, the expected monetary value of each response must be calculated. | To determine which risk response is most cost/beneficial in terms of probability and costs, the expected monetary value of each response must be calculated. | ||
| − | <math> _{ | + | <math> _{P(S|A)=0.99} </math> , <math> _{P(F|A)=0.01} </math> |
Revision as of 09:54, 2 October 2017
Abstract
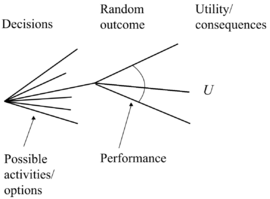
Decision Tree as a tool in Risk Management. [2]
When the risks have been identified and the respective impacts and probabilities have been investigated, the decision whether to insure, mitigate, accept or externalise the risk in question will result in different possible outcomes with different probabilities and consequences. From these different branches other risk decisions will be made, and in the end a decision tree with all the possible different paths to what risks will be managed and how, will be established.
This wiki article investigates how the decision tree works as a tool in risk management, what the benefits are and what barriers are related to this tool.
 θ
θ
1. The Decision Tree Concept
2. Applying the Decision Tree to Project Management
3. Other Risk Management Tools Involved
4. Benefits and Possibilites
5. Limitations and Barriers
6. Conclusion
7. References
8. Annotated Bibliography
Writer: Frederik Lind, s133570
Contents |
The big idea
DECISION TREE[2]
Initial Steps to Decision Making
Risk Identification
The identification of risks is a process that must begin early in the project during the planning phase and it must be done thoroughly to mitigate potential delays, change of scope, budget overruns and quality loss.[4]
While the definition of the term risk involves only the possibility of experiencing unfavorable events, risk identification within the project context however both includes the opportunities (positive outcomes) and the threats (negative outcomes).[5]
It is practically impossible to identify all risks before they occur, however it is possible to map an extensive majority through a combination of a number of identification methods.
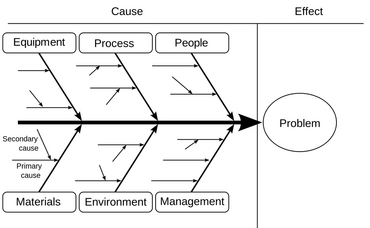
A common first step to identifying risks is to organize the possible risks in branches of causes, Figure 1.
A list of risks can be gathered through brainstorming, interviews and checklist analysis in collaboration with the project team, experts and stakeholders by focusing on what possible events and their sources within each branch that will affect changes in scope, cost, time and quality of the outcome of the project.[3]
Risk Assessment
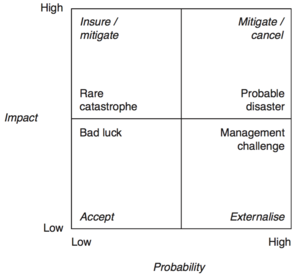
The next step is to assess the potential risks where the goal is to define the consequence and likelihood ranges for each risk source in collaboration with the stakeholders. A tool to visually map the respective probabilities and impacts for each risk and to get an immediate overview of desired response approach is to apply the Probability/Impact Matrix, Figure 2.[2]
The impact of a threat or opportunity occurring will always be associated with a direct or an indirect increase or decrease in cost for the project. The cost related to each consequence must be estimated and registered.
When the probabilities and levels of impact have been evaluated, the planning team should be divided into different field-specific sub-groups to which the respective related risks should be assigned for possible response investigation.[7]
Risk Response Analysis
The assigned sub-groups will then identify any possible actions to prevent risks and to enhance opportunities.[7]
Different response options are often available for each risk source, and the angle of attack to construct the final list of approaches for all risks can be inspired by the Probability/Impact Matrix, Figure 2. The response approach consists generally of four pillars: accept, externalise, mitigate and insurance against the risk. A fifth immediate option is to delay the response decision until more information is available.[6]
- Accept the risk. If the risk is accepted a response to the risk event occurring should be planned.
- Externalise the risk. When contracting out the source of the risk down the supply chain of the project structure, the sub-contractor in charge must be in a better position to handle the risk. The secondary risk associated with this response is that the sub-contractor will fail the commitments and either go bankrupt, hand the risk back to the principal or withdraw from the project.
- Mitigate the risk. This response underlines the necessity to risk manage very early in the project and is the main reason behind risk management. By mitigating or avoiding risks, the probabilities of risks are minimized leading to reduced delays, change orders and budget overruns. Mitigating and avoiding a threat can be done in a various number of ways and determining the possibilities to mitigate/avoid the risks or enhance/create opportunities is the main key to benefit from the decision tree.
- Insure against the risk. This response is not always possible but for uncontrollable rare catastrophes insurance is usually possible, such as fire.
- Delay the response. By delaying the response decision until more information is available, it is sometimes possible to make more efficient and tailored risk responses. This approach is often used for unknown risks where a frame for handling the risk event is the only option.
[6]
To fully exploit the opportunities related to using the decision tree, the different response angles for all estimated risks should be investigated and listed. Furthermore every preventive or enhancing action or lack hereof is associated with a direct cost which is important to determine to make a thorough scientific base for the decision tree.
Decision Tree - Treating Risks
The Concept
yes yes this is math 
Applying the Decision Tree
A planning team has initialized a risk analysis for the construction of a minor power plant. Through brainstorming, interviews and checklist analyses in collaboration with the project team, experts and stakeholders a wide list of potential risks is identified.
The list of risks is then assessed with the likelihood ranges and consequences estimated in terms of probabilities and costs respectively for each corresponding risk.
The planning team is then divided into field specific sub-groups to perform a risk response analysis, thus investigating the possible measures to mitigate, avoid, accept, externalize and insure every risk. Every potential risk response is affiliated with a direct cost and a probability of the response resulting in the risk event being avoided, of which all must be estimated and listed.
Decision tree for one risk
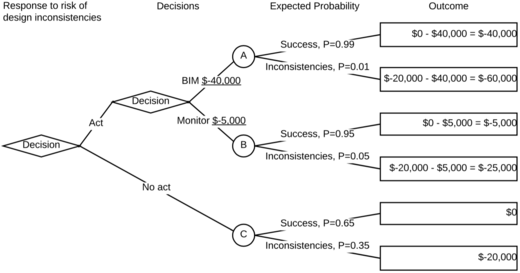
The firm has constructed similar projects in the past and from experience the planning team knows that the most substantial risk is inconsistencies between structural and installation design plans. The cost of inconsistencies occurring is estimated to $20,000 and with no inconsistencies expected in the initial budget planning, the two possible outcomes are listed:
| Consequence of risk | Outcome |
|---|---|
| No inconsistencies | $0 |
| Inconsistencies | $-20,000 |
Besides the possibility to accept the risk, the field specific sub-group identifies two potential responses to avoid this risk from happening. The three options are listed:
- Replace traditional processes and methods with BIM for easy clash detection
- Monitor the levels of consistencies more thoroughly through the development process
- Do nothing
The firm has never used digital solutions in construction planning before, and the planning team knows that replacing the traditional processes of making physical design drawings with BIM and digitally created models requires a larger investment than the potential cost of inconsistencies occurring. The planning team inquires with the risk manager whether they should discard BIM as a potential response but the manager tells them to keep investigating every possible measure.
The planning team determines the direct costs for each potential response:
| Action | Cost | |
|---|---|---|
| A: | BIM | $-40,000 |
| B: | Monitor | $-5,000 |
| C | No act | $0 |
Statistics from earlier power plant constructions indicate that the probability of inconsistencies occurring is 0.35 (35%) when no risk response is initiated. By investigating the levels of success by implementing BIM in other construction projects in regard to clash detection a probability of success is estimated to 0.99. At the same time by applying more man hours to monitor the consistencies of the model designs throughout the planning process a probability of experiencing no inconsistencies is estimated to 0.95:
| Action | Probabilities of outcome | |
|---|---|---|
| Success | Inconsistencies | |
| BIM | 0.99 | 0.01 |
| Monitor | 0.95 | 0.05 |
| No act | 0.65 | 0.35 |
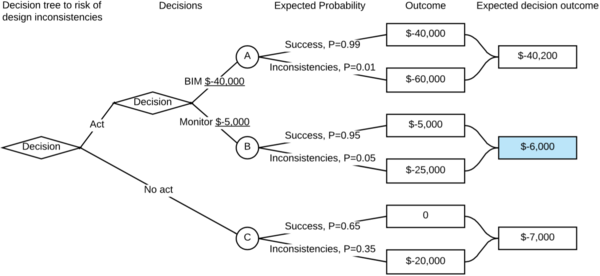
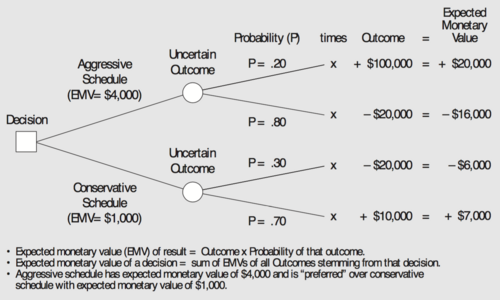
The planning team then establishes a decision tree with the potential actions leading to the estimated possible outcomes with respective probabilities in accordance with Figure 5 and Figure 6. The monetary consequence of each potential outcome is determined and noted on the decision tree.
When the monetary outcomes have been determined, the planning team must evaluate what risk responses are realistic. If the planning team decides to respond to the risk of inconsistencies by implementing BIM, they must assure that the potential outcome of experiencing inconsistencies despite the use of BIM will not result in the firm going bankrupt. In this case the firm has a solid economy.
To determine which risk response is most cost/beneficial in terms of probability and costs, the expected monetary value of each response must be calculated.
 ,
, 
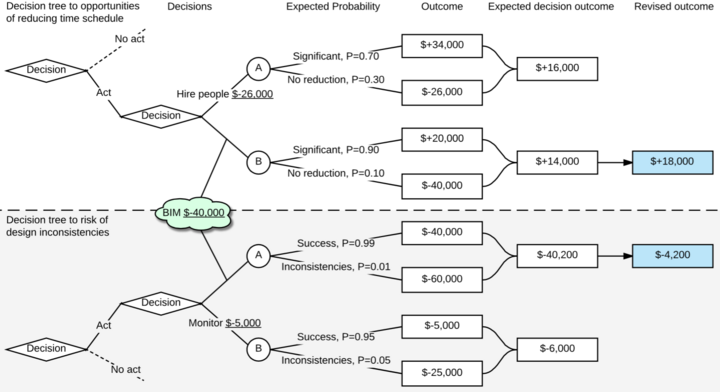
Yes yes many benefits with BIM [8]
Usability for Project, Programme and Portfolio Risk Management
Benefits and Possibilites
Decreased costs, increased earnings, reduction in time and investment in future efficiency.
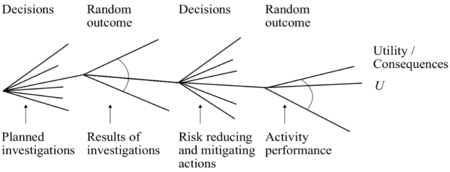
Pre and Posterior Decision Making
Limitations and Barriers
Some risks can not be used in the decision tree because they would cause too severe consequences and will have to be avoided or externalized.
The probabilities of risks happening can only be estimated to a certain degree of actuality.
Conclusion
Annotated Bibliography
References
- ↑ 1.0 1.1 Faber, Michael Havbro (2010) Statistics and Probability Theory - In Pursuit of Engineering Decision Support, Publisher: Springer International Publishing AG.
- ↑ 2.0 2.1 2.2 Geraldi, Joana and Thuesen, Christian and Stingl, Verena and Oehmen, Josef (2017) How to DO Projects? A Nordic Flavour to Managing Projects: DS-handbook, Version 1.0, Publisher: Dansk Standard
- ↑ 3.0 3.1 Geraldi, Joana and Thuesen, Christian and Stingl, Verena and Oehmen, Josef (2017) Risk identification - basic methods, http://www.doing-projects.org/Conceptbox/Risk-identification-basic-methods [retrieved Sep 20th 2017], Publisher: Doing-Projects.org.
- ↑ Jutte, Bart (2016) 10 GOLDEN RULES OF PROJECT RISK MANAGEMENT, https://www.projectsmart.co.uk/10-golden-rules-of-project-risk-management.php [retrieved Sep 20th 2017], Publisher: Public Smart.
- ↑ 5.0 5.1 Duncan, William R. (1996). A Guide to the Project Management Body of Knowledge, Project Management Institue: PMI Standards Committee.
- ↑ 6.0 6.1 6.2 Winch, Graham M. (2010) Managing Construction Projects - An Information Processing Approach, 2nd Edition, Publisher: John Wiley & Sons, Ltd.
- ↑ 7.0 7.1 Wrona, Vicki (2015) YOUR RISK MANAGEMENT PROCESS: A PRACTICAL AND EFFECTIVE APPROACH, https://www.projectsmart.co.uk/your-risk-management-process-a-practical-and-effective-approach.php [retrieved Sep 22nd 2017], Publisher: Public Smart.
- ↑ Lambrecht, Jan Fuglsig and Vestergaard, Flemming and Karlshøj, Jan and Hauch, Peter and Mouritsen, Jan (2016) Measuring the effects of using ICT/BIM in construction projects. Proceeding at CIB W78 conference, Brisbane, Australia.
