Toolbox
(→People) |
|||
| Line 56: | Line 56: | ||
[[File:bbb.jpg|thumb|Figure 3: Decission tree <ref name=" [h6]"/>|300px]] | [[File:bbb.jpg|thumb|Figure 3: Decission tree <ref name=" [h6]"/>|300px]] | ||
| + | |||
| + | |||
| + | =Complexity= | ||
| + | The underestimation of a project’s complexity is directly linked to its failure. The consequences of complexity is a stochastic procedure thus its extremely difficult to be avoided or controlled. The direct link to the uncertainty is often overlooked due to the fact that the environment of an engineering project under development is constantly changing. | ||
| + | Attempting to reduce the causes of a certain complex node is not a sufficient method of confrontation. The complexity footprint to be set in each individual project is dependent from the balance and the analysis level on the majority of the interlinked elements, extending to their intricate interactions and synergy. To commence a successful managerial attempt the main drivers must be recognized from their subjective grade and their dynamic effect. | ||
| + | Adaptability and co-forming the framework is mandatory to increase the chances of improved decision-making in a developmental phase of a project. | ||
| + | To figure the proper assessment of an engineering project, certain strategic managerial tools must be implemented in a versatile alignment, meaning that they should not be used compulsory in the order they are referred to. Due to the high polymorphic engineering developmental spectrum, this specific chain of tools is an attempt on finding a common denominator and pattern for the early stages of a project. | ||
| + | |||
| + | ==Gantt Chart== | ||
| + | |||
| + | Emphasizing on the assessment of complexity and set a basis the Gantt Chart must be utilized. The need to schedule and differentiate the tasked required is fulfilled by the structure of the chart. Bars are horizontally placed illustrating the duration of each individual process setting demands, hierarchy and limitation to the subtotal picture. The possible dependencies among the tasks are separated into the following categories depending on their level of importance and completion demands: | ||
| + | • Finish to Start FS | ||
| + | • Start to Start SS | ||
| + | • Finish to Finish FF | ||
| + | • Start to Finish SF | ||
| + | These conditions differ depending on the identity and needs of each task as shown in the Figure 4. Approaching a procedure with the predecessors and the successors logic in tasks will analytically visualize critical assessments. Dividing a complex matter into smaller subparts aids with the demonstration of allocation, time span and dependencies. The discipline to end tasks in time is a key note for the total success of a complex project, while its easily implementable through front-end software. | ||
| + | |||
| + | [[File:gc.jpg|thumb|Figure 3: Gantt Chart Example |200px]] | ||
| + | |||
| + | ==Life Cycle Model== | ||
| + | To define the criteria and the expected results for each phase, demonstrated by the general framework, the Life Cycle Model can be emerged as a common denominator. Allowing the evaluation of technical systems depending on their chronological position in the total life cycle provides a theoretical structure to commence or continue a case analysis. The general divide can be established by the following cornerstone stages and the connectivity in between is set by the decision gates that exist in the end of one phase and at start of the other. After each step there is a case example to evaluate the emerged quality. Development phase is one of the most crucial since the decisions made are so early that affect the total image. Realization Phase covers the transition phase between development and utilization divided in two steps. First the system realization that includes transformation tasks of the concept and secondly the implementation and installation of the guidelines. Utilization phase is an operative procedure fully monitored by a suitable performance system that tracks any deviations. Disposal Phase is the decomposing phase of a project. Total removal or total redesigning of a case can be established depending on the scale of the demand and the activity cycle. Variations of these stages can exist related to the root and nature of the special condition of each engineering project. In the context of sustainability is establishes a backbone for straightforward risk and environmental impact throughout the holistic view of a system. | ||
| + | |||
=References= | =References= | ||
Revision as of 14:27, 21 February 2020
Contents |
Purpose
Business case
The business case is the document that contains the most relevant information about the project and it represents the justification for the business. The crucial information it has to contain is the reasons, options, benefits and dis-benefits, timescale, cost, major risks and opportunities.
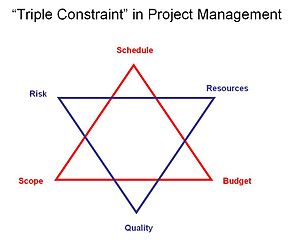
When defining a business case it is necessary to define the schedule, risk, resources, budget, quality and scope. These five main areas define the called Six Star Constraint Model.

There are three main tools in order to define the business case, its definition can be followed bellow:
- Cost/benefit analysis: it serves to quantify if the difference between the cost and the expected revenue [1].
- Payback period: its objective is to compare the revenue generated each year and the inicial investment in order to obtain the profit.
- Net Present Value (NPV): it is an indicator of the feasibility of the project. It is the difference between the present value of cash inflows and the present value of cash outflows over a period of time [2].
Feasibility study
A feasibility study is an analysis whose objective is to get the likelihood of project success. It takes into account the most relevant influence factors. These factors are the following: [3]
- Technical: it focuses on the technical resources and helps the organisation determining if the technical team is able to deal with the technical challenges.
- Economic: it involves cost-benefit analysis and helps the organisation to check the feasibility of the project.
- Operational: its objective is to establish the organisation to accomplish the objectives.
- Legal: it takes into account all the framework in order to find is there are any conflicts between it and the project.
- Scheduling: its objective is to estimate how much time the project will take to complete [4].
People
Regarding project management, it is very important to understand the people involved and their individual interests towards it.
Stakeholder map
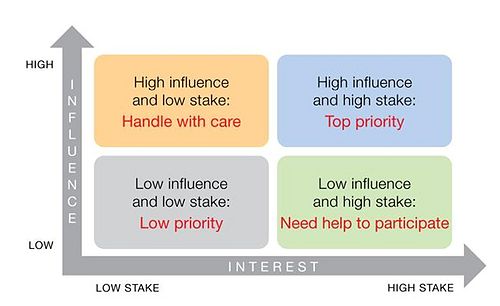
Stakeholders are people interested in a company or a project, and can be affected directly or indirectly from it. In every engineering project it is necessary to manage properly the people involved, such as investors, suppliers, clients and line managers, because each of them has a distinct interest in the completion of the same. It is very important to do this after identifying the purpose of the project, otherwise a wrong understanding of stakeholders can occur [h1]. A stakeholder map is the ideal tool to accomplish this and have every part involved internally and externally in the project satisfied. All stakeholders are not the same, they have different influences and interest surrounding the project. Commonly, stakeholders are differentiated or classified depending on three criteria: power, legitimacy and urgency [h2]. Stakeholders mapping can lead to many results and outcomes, and it is important to focus the outcomes to achieve a proper stakeholder engagement at all levels. In addition, improving stakeholder affinity, that depends on power and interest, is a crucial point to take into account. Some stakeholders have more influence than others and it is mandatory to recognize this by means of stakeholder mapping as well. A matrix where each and every stakeholder is classified is what the method suggests [h2]:

From the matrix it is intuitive to find the stakeholders that have the higher influence. From this it is deducted that a higher priority has to be given to them to make sure they have their demands satisfied. This can be done after the analysis of all the stakeholders. The most typical vias to integrate stakeholders are: buffering, co-optation, mutual learning and meta-problem solving [h3].
Uncertainty
In engineering, uncertainty is present in every new project as it is very difficult to exactly predict the exact outcomes that it will produce. This is a tonic in engineering as the information and data available is most of the times unreliable, due to the fact that many predictions and forecasts must be performed. Furthermore, uncertainty leads to risk and there are some tools that can help to achieve a proper study to be able to take the best decisions and be fully informed. Risk management, SWOT analysis and the decision tree are very powerful to obtain this.
Decision tree
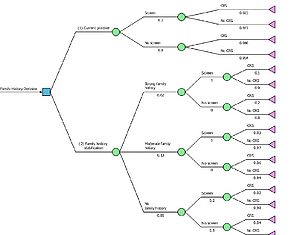
The decision tree is a very powerful tool to analyze the different decisions and outcomes that can be taken in a project by means of a tree-like model. It defines the probabilities for each of the possibilities. This way it is possible to determine the expected future for each of the scenarios. One of the main disadvantages is that one change in the data can change all the possible outcome and therefore the route to follow [h7], including that these trees can become very complex.

Complexity
The underestimation of a project’s complexity is directly linked to its failure. The consequences of complexity is a stochastic procedure thus its extremely difficult to be avoided or controlled. The direct link to the uncertainty is often overlooked due to the fact that the environment of an engineering project under development is constantly changing. Attempting to reduce the causes of a certain complex node is not a sufficient method of confrontation. The complexity footprint to be set in each individual project is dependent from the balance and the analysis level on the majority of the interlinked elements, extending to their intricate interactions and synergy. To commence a successful managerial attempt the main drivers must be recognized from their subjective grade and their dynamic effect. Adaptability and co-forming the framework is mandatory to increase the chances of improved decision-making in a developmental phase of a project. To figure the proper assessment of an engineering project, certain strategic managerial tools must be implemented in a versatile alignment, meaning that they should not be used compulsory in the order they are referred to. Due to the high polymorphic engineering developmental spectrum, this specific chain of tools is an attempt on finding a common denominator and pattern for the early stages of a project.
Gantt Chart
Emphasizing on the assessment of complexity and set a basis the Gantt Chart must be utilized. The need to schedule and differentiate the tasked required is fulfilled by the structure of the chart. Bars are horizontally placed illustrating the duration of each individual process setting demands, hierarchy and limitation to the subtotal picture. The possible dependencies among the tasks are separated into the following categories depending on their level of importance and completion demands: • Finish to Start FS • Start to Start SS • Finish to Finish FF • Start to Finish SF These conditions differ depending on the identity and needs of each task as shown in the Figure 4. Approaching a procedure with the predecessors and the successors logic in tasks will analytically visualize critical assessments. Dividing a complex matter into smaller subparts aids with the demonstration of allocation, time span and dependencies. The discipline to end tasks in time is a key note for the total success of a complex project, while its easily implementable through front-end software.
Life Cycle Model
To define the criteria and the expected results for each phase, demonstrated by the general framework, the Life Cycle Model can be emerged as a common denominator. Allowing the evaluation of technical systems depending on their chronological position in the total life cycle provides a theoretical structure to commence or continue a case analysis. The general divide can be established by the following cornerstone stages and the connectivity in between is set by the decision gates that exist in the end of one phase and at start of the other. After each step there is a case example to evaluate the emerged quality. Development phase is one of the most crucial since the decisions made are so early that affect the total image. Realization Phase covers the transition phase between development and utilization divided in two steps. First the system realization that includes transformation tasks of the concept and secondly the implementation and installation of the guidelines. Utilization phase is an operative procedure fully monitored by a suitable performance system that tracks any deviations. Disposal Phase is the decomposing phase of a project. Total removal or total redesigning of a case can be established depending on the scale of the demand and the activity cycle. Variations of these stages can exist related to the root and nature of the special condition of each engineering project. In the context of sustainability is establishes a backbone for straightforward risk and environmental impact throughout the holistic view of a system.
References
[1] https://youtu.be/bDAsAbMMep0, Procurement Academy 2015, Business Case - Definitions [2] https://www.investopedia.com/terms/n/npv.asp [3] https://www.investopedia.com/terms/f/feasibility-study.asp [4] https://www.simplilearn.com/feasibility-study-article [5] https://www.google.com/search?q=Six+Star+Constraint+Model&sxsrf=ALeKk01pjWlR-dv-zceA2NRuOVZlmDn4AA:1582289819396&source=lnms&tbm=isch&sa=X&ved=2ahUKEwjCn_f02OLnAhWJqIsKHZYcBPAQ_AUoAXoECAwQAw&biw=965&bih=742#imgrc=Hx8rVvdQQUeDXM [4] https://www.investopedia.com/terms/f/feasibility-study.asp [h1] http://wiki.doing-projects.org/index.php/Stakeholder_Management [h2] https://www.stakeholdermap.com/ [h3] https://www.researchgate.net/figure/Typology-of-Stakeholder-Integration-Mechanisms_fig1_254800916 [h4] https://www.investopedia.com/terms/s/stakeholder.asp [h5] https://www.iaea.org/resources/nuclear-communicators-toolbox/methods/planning/stakeholder-analysis [h6] https://conceptdraw.com/a1917c4/preview [h7] https://www.ncbi.nlm.nih.gov/pmc/articles/PMC5767274/
Cite error:
<ref> tags exist, but no <references/> tag was found
