TeamSted
(→Tool 3 - Bubble diagram) |
(→Definition) |
||
| Line 115: | Line 115: | ||
====Definition==== | ====Definition==== | ||
| − | The BCG Matrix (Boston Consultant Group) is a world wide known tool that can be used as a tool when trying to visualize a company`s project portfolio. The matrix consists of 4 quadrants, each of those represent a state the project is currently in. Therefore a skeptical look must be applied. Different views from distinct people from all of the company`s departments should be considered in order to a well | + | The BCG Matrix (Boston Consultant Group) is a world wide known tool that is manly applied for consideration of products, however it can also be used as a tool when trying to visualize a company`s project portfolio. The matrix consists of 4 quadrants, each of those represent a state the project is currently in. Therefore a skeptical look must be applied. Different views from distinct people from all of the company`s departments should be considered in order to a well accurate Matrix to be created. The horizontal axis of the matrix correspond to the "Relative market share", and the vertical axis is the "Market growth rate" of the considered projects. An example of BCG Matrix can be seen on the figure, and as shown, the 4 different quadrants are defined as: "Question Marks", "Stars", "Cows" and "Dogs". |
====Practical guidelines /how to==== | ====Practical guidelines /how to==== | ||
Revision as of 17:29, 27 February 2020
Work in progress!!! This article will contain a reporting on relevant tools related to case work conducted together with Ørsted.
And remember boyzzz, we draw all the figures ourself. If you are not good at it, draw a draft and it will be revised.
| Erik Arvid | Hosszu | s200154 |
| Jacob | Clemmensen | s144069 |
| Björgvin | Hjartarson | s154659 |
| Breno | Strüssmann | s193580 |
| Tobias | Thyssen | s143786 |
| Hashim | Harmeed | s193272 |
Contents |
Introduction
Tools
Introduce the tools chosen and why they were chosen (importance). Also relevance to the specific case
Tool 1 - SWOT
SWOT is a framework model used for identifying and analyzing the strength, weakness, opportunities and threats within a company. The model is divided into internal factors (strength and weakness) and external factors (opportunities and threats).- Strength: The first element highlights the strength within a company and investigates how they distinguish from competitors.
- Weakness: The second element highlights the weakness within a company, and critically investigates what other companies do better.
- Opportunities: The third element highlights the opportunities within a company, and looks into the company development of new ideas that lead to new markets
- Threats: The fourth element highlights the threats within a company, and investigates what may affect the success and growth of a company
Generally, SWOT is an efficient and valuable tool to gain insight into, what is realistic to achieve and where the focus area should be. The managers within a company can easily identify and evaluate if their goals are achievable and if they are not, then the SWOT model can be modified by going through each of the four elements.
Tool 2 - Stakeholder Mapping
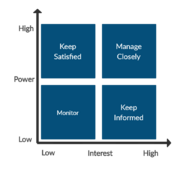
Stakeholder mapping is a crucial aspect of the stakeholder management. The purpose of the tool is to understand the project stakeholders, since it is a core element for doing successful projects.The first step in a stakeholder mapping is to find the key stakeholders related to a project and identifying the individuals that have interest in the outcome of the project. After identifying the stakeholders, the manager must map or classify them in relation to engagement level of the project. The actual mapping process is divided into the level of interest and level of influence.....
Tool 3 - Bubble diagram
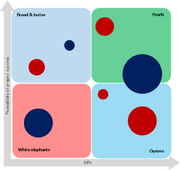
The Bubble diagram is a multipurpose visual decision-making tool used in project portfolio management.The diagram originates in a standard x-y plot were circles are used to indicate a given entry. Where a bubble diagram differentiates from similar diagrams is in the information stored in the diagram. Two extra dimensions can be added to the plot in color-coding of the entire and the size of the circles. The most common type of bubble chart is a Risk-Reward chart showing the Net Present Value(NPV) relative to the probability of success of a given project. This is also the type that is used to showcase a bubble diagram as seen in figure XX. Here the urgency of the project is quantified in a color code where red marks the most urgent projects. The size of the circle indicates the extent of the project, this can contain several elements dependent on the project type i.e information needed or the number of estimated work hours.
The Risk-Reward chart maps projects into four distinct categories to help the portfolio manager make a decision based on the individual projects' business profitability. The four categories are the four quadrants of the diagram, each is named after how the manager should relate to them:
- Bread and Butter: The Projects located in the upper left quadrant falls into this category. They are low-risk projects but there projected outcome is also low therefor they are a safe investment.
- Pearls: If a project falls in the upper right quadrant they are called Pearls these projects have high profitability of success and have potential large rewards. These are the projects that a business should aspire towards.
- White Elephants White Elephants are located in the lower-left corner these projects are high-risk low reward projects. These projects should be avoided.
- Oysters All projects in the lower right quadrant holds the potential of becoming a star project do to a potential high NPV, but they come with a low probability of success. These projects are often innovative new projects and therefore should be considered by the decision-maker.
The bubble diagram is a versatile tool that can be used as a relatively prompt way to base a decision on.
Tool 4
Definition
Practical guidelines /how to
Benefits and limitations
Tool 5
Definition
Practical guidelines /how to
Benefits and limitations
Tool 6
Definition
Practical guidelines /how to
Benefits and limitations
Tool 7
Definition
Practical guidelines /how to
Benefits and limitations
Tool 8
Definition
Practical guidelines /how to
Benefits and limitations
Tool 9
Definition
Practical guidelines /how to
Benefits and limitations
Tool 10 - BCG Matrix
Definition
The BCG Matrix (Boston Consultant Group) is a world wide known tool that is manly applied for consideration of products, however it can also be used as a tool when trying to visualize a company`s project portfolio. The matrix consists of 4 quadrants, each of those represent a state the project is currently in. Therefore a skeptical look must be applied. Different views from distinct people from all of the company`s departments should be considered in order to a well accurate Matrix to be created. The horizontal axis of the matrix correspond to the "Relative market share", and the vertical axis is the "Market growth rate" of the considered projects. An example of BCG Matrix can be seen on the figure, and as shown, the 4 different quadrants are defined as: "Question Marks", "Stars", "Cows" and "Dogs".


