Femern
(→Stakeholder Management) |
|||
| Line 87: | Line 87: | ||
This tool supports comparison between the current engagement levels and desired engagement levels of the stakeholders in your project. The engagement levels can be classified as Unaware, Resistant, Neutral, Supportive, and Leading. Then, from these categories, the stakeholders can be split into current (C) and desired (D) levels of engagement. | This tool supports comparison between the current engagement levels and desired engagement levels of the stakeholders in your project. The engagement levels can be classified as Unaware, Resistant, Neutral, Supportive, and Leading. Then, from these categories, the stakeholders can be split into current (C) and desired (D) levels of engagement. | ||
| + | |||
| + | [[File:Stakeholder Engagement Assessment Matrix.png |500px|Figure 4: Stakeholder Engagement Assessment Matrix]] | ||
==Bibliography== | ==Bibliography== | ||
<references/> | <references/> | ||
Revision as of 15:36, 6 March 2020
Contents |
Project Quality Management
Plan Quality Management: Data Analysis[1]
Data Analysis is one of the tools used for Plan Quality management. There are two major techniques used for Data Analysis, which are cost-benefit Analysis and cost of quality.
Cost-benefit Analysis is used for analysis of alternatives, and help determine the most beneficial alternative. This is done by estimating the strengths and weaknesses of the alternatives
Cost of quality can help the company keep high quality and thereby lead to savings. Cost of quality consist of three costs.
Prevention costs are costs used to prevent poor quality. Appraisal costs are costs for appraisal, such as evaluating and testing products, deliverables or services. Failure Costs are costs linked to failure in products, deliverables or services.
Manage Quality: Data Representation[1]
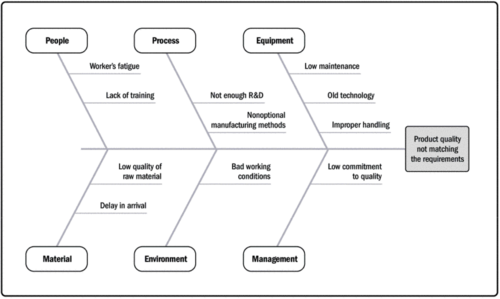
Data Representation is used to show data of an organization. They can among others, show issues and defect in certain areas, which needs more attention. Data Representation is mostly illustrated as a diagram or chart. Types of data representation includes affinity diagram, cause-and-effect diagram, flow chart and histogram.
Schedule Management
Estimation of Activity Durations: Three-Point Estimating[2]
Three-point estimating is a tool used to estimate the duration of an activity. It is used primarily when there is insufficient historical data available to produce an estimate. The tool considers a most likely time (tM), optimistic time (tO) and pessimistic time (tP) to produce the best estimate via the following equation:
tE = (tM + tO + tP)/3
Using this triangular distribution estimation uncertainty and risk can be reduced with respect to single-point estimating. Total project duration may then be estimated by finding the summation of individual activity durations through an integrated activity execution flow chart (e.g. Gantt chart).
Development of a Schedule: Critical Path Method[2]
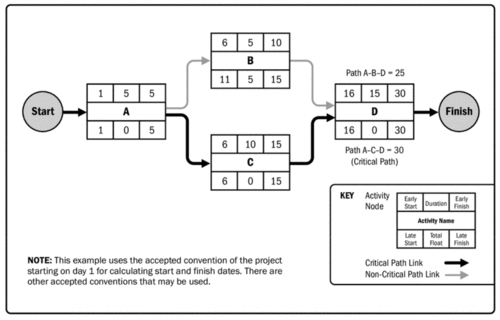
The critical path method is used to produce to calculate the minimum project duration and the amount of schedule flexibility available on the logical network paths within the schedule model. The analysis calculates the early and late start and finish dates of each activity using activity duration estimates. Using the scheduled activity network, the longest activity path (namely 'critical path') is then computed (see path 'ACD' Figure 3). This is used as the project duration estimate. The 'float' of activities not on the critical path is determined, defined as the maximum duration the activity can be delayed by without delaying the project as a whole. This is used to determine the schedule flexibility within the schedule model.
Cost Management
Estimation of Cost: Bottom-Up Estimating[2]
A method used putting the activity of a project into more details. As the name indicates it goes from the bottom and upwards, meaning that the expected costs are accounted for at the highest level of detail. There are pros and cons of using this method.
| Pros | Cons |
|---|---|
| Accurate results are gained (project cost will become very close to the estimated cost) | The method is very timeconsuming |
| - | The method requires project managers with experience in a certain field |
Communications Management
Plan Communications Management: Communication Technology[3]
Communication Technology is a tool used to properly plan the method of sharing information among stakeholders.
Different platforms may be used to accomplish this, such as conversations, minutes of meetings (MOM), written documents and social media. Some factors should be considered in order to define the best communication method for a specific topic:
- Urgency, frequency and format
- Compatibility, availability and easy to access among all stakeholders
- Project enviroment (Face-to-face or virtual based)
- The sensitivity and confidentiality of the information
Furthermore, the communication channels may vary within each project phase.
Communications Management: Conflict Management[3]
Conflicts will always occur in project work; sourcing from differing priorities, lack of understanding, and differences of persons working in the project. Managers must be able to discretely handle these conflicts as to not exacerbate the intensity of the conflict and come to a satisfactory solution for all the parties involved. Letting both sides of a conflict explain their reasoning and queries will enable each side to at least feel that they’ve been heard, even if the solution is not what they may have wanted.
The approach managers should take in conflict management depend greatly on factors involved; these include:
- Stakes involved
- Stakeholders
- Demanded outcomes
- Timescale
There are many techniques for resolving conflicts. These include:
- Withdraw/avoid
- Smooth/accommodate
- Compromise/reconcile
- Force/direct
- Collaborate/problem solve
Stakeholder Management
Stakeholder Engagement Assessment Matrix[4]
This tool supports comparison between the current engagement levels and desired engagement levels of the stakeholders in your project. The engagement levels can be classified as Unaware, Resistant, Neutral, Supportive, and Leading. Then, from these categories, the stakeholders can be split into current (C) and desired (D) levels of engagement.
Bibliography
- ↑ 1.0 1.1 https://app-knovel-com.proxy.findit.dtu.dk/web/view/khtml/show.v/rcid:kpGPMBKP02/cid:kt011DXC52/viewerType:khtml//root_slug:8-project-quality-management/url_slug:project-quality-management?kpromoter=federation&b-toc-cid=kpGPMBKP02&b-toc-root-slug=&b-toc-url-slug=project-quality-management&b-toc-title=Guide%20to%20the%20Project%20Management%20Body%20of%20Knowledge%20(PMBOK®%20Guide)%20(6th%20Edition)&page=1&view=collapsed&zoom=1
- ↑ 2.0 2.1 2.2 https://app-knovel-com.proxy.findit.dtu.dk/web/view/khtml/show.v/rcid:kpGPMBKP02/cid:kt011DX7BB/viewerType:khtml//root_slug:6-project-schedule-management/url_slug:project-schedule-management?kpromoter=federation&b-toc-cid=kpGPMBKP02&b-toc-root-slug=&b-toc-url-slug=project-schedule-management&b-toc-title=Guide%20to%20the%20Project%20Management%20Body%20of%20Knowledge%20(PMBOK%C2%AE%20Guide)%20(6th%20Edition)&page=1&view=collapsed&zoom=1
- ↑ 3.0 3.1 https://app-knovel-com.proxy.findit.dtu.dk/web/view/khtml/show.v/rcid:kpGPMBKP02/cid:kt011DXH02/viewerType:khtml//root_slug:10-project-communications-management/url_slug:project-communications?kpromoter=federation&b-toc-cid=kpGPMBKP02&b-toc-root-slug=&b-toc-url-slug=project-communications&b-toc-title=Guide%20to%20the%20Project%20Management%20Body%20of%20Knowledge%20(PMBOK%C2%AE%20Guide)%20(6th%20Edition)&page=1&view=collapsed&zoom=1
- ↑ https://app-knovel-com.proxy.findit.dtu.dk/web/view/khtml/show.v/rcid:kpGPMBKP02/cid:kt011DXOQE/viewerType:khtml//root_slug:13-project-stakeholder-management/url_slug:project-stakeholder-management?kpromoter=federation&b-toc-cid=kpGPMBKP02&b-toc-root-slug=&b-toc-url-slug=project-stakeholder-management&b-toc-title=Guide%20to%20the%20Project%20Management%20Body%20of%20Knowledge%20(PMBOK%C2%AE%20Guide)%20(6th%20Edition)&page=20&view=collapsed&zoom=1


