Utilizing Value Functions for Evaluating the Performance of Project Alternatives
(→Value Functions) |
|||
| Line 9: | Line 9: | ||
== Value Functions== | == Value Functions== | ||
| + | Value functions are a mathematical model which can translate stakeholder preferences and ideals into a less biased scale. Value functions should be used when the decision maker needs to choose a specific solution from a pool of solution alternatives. By creating a value function the decision maker will be able to identify the solution that will give the greatest reward. This is done by combining the indexes of all the alternatives into a measurable index of preferability. Value functions can be used to determine the value of a thing by looking at both tangible and intangible aspects. Thus, it properly evaluates all relevant aspects of a project, concept, or idea and their alternatives. A value function considers the value of a solution alternative on each of the criterions used in the decision basis. The primary function of the value function is to support the stakeholder in assigning value to each alternative, and then use the weight of each criterion to find the final benefit of the solution alternative. It should be noted that for each criterion a value function should be created. | ||
| + | Value functions are useful when evaluating and comparing similar solution alternatives, as they assign a specific value to each solution alternative, creating a preferential structure. Often when evaluating a solution alternative or project several value functions are used, one for each of the performance criteria (also known as key performance indicators (KPIs) ). From these each solution alternative or projects performance can be assessed through the specific score/value that the solution alternative or project obtains on the value function scale. | ||
| + | As value functions are a mathematical expression, they follow axioms, the most essential are that the preferences expressed by value functions should be coherent, thus they must be transitive and complete. This means that if project a is better then project b, and b is better then project c, then project a is better than c. It also means that either one project is better than the other or they are indifferent (project a is equally good as project b). | ||
| + | Thus an alternative is only preferred to another alternative if its score on the value function is better than the other. If the scores are the same, then there will be indifference between the alternatives, meaning that they perform equally well. | ||
| + | '''Types of value functions''' | ||
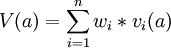
| + | The most used value function model is the additive model: | ||
| + | |||
| + | <math>V(a)=\sum^n_{i=1}w_i *v_i(a)</math> | ||
| + | |||
| + | Here V(a) refers to the total value of the solution alternative, <math>w_i</math> refers to the weight (the importance) of criteria i, and <math>v_i</math> refers to the value of the criteria for the solution alternative. The additive model is easy to use, and especially easy for stakeholders to understand, making it the most used value function. In decision making it is essential that the stakeholder understands the process and thus the indicated solution preference. The additive model looks at each criterions impact on the complete value. It is also easy to change, add, and remove criteria from the model. | ||
| + | |||
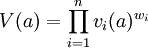
| + | An alternative to the additive model is the multiplicative model: | ||
| + | |||
| + | <math>V(a)=\prod^n_{i=1}v_i(a)^{w_i}</math> | ||
| + | |||
| + | The multiplicative model is harder for stakeholders to understand, however it better accounts for interdependencies between the criteria on the solution alternative. Thus it is better suited for finding an alternative which performs well on all criteria. This form of value function is best suited when the weights for each criteria is well known. Once a value type is decided upon there are various ways of creating the value function. Two of these are divulged here, the bisectional method and the difference method. | ||
| + | |||
| + | '''The bisectional method''' | ||
| + | |||
| + | The bisectional method is a direct method which needs input from the stakeholder. Here the stakeholder will identify the two end points of the value function, so the maximum and minimum value an attribute can have (this will depend on the chosen scale, see the scales section below). Then the stakeholder will identify where, between the two endpoints, the value is half, so when would the stakeholder consider a solution to have half the value of the maximum outcome. As an example, let’s consider a program where an objective is reducing emissions. When choosing a project for this program it is thus beneficial to consider how it contributes to the reduction of emissions. The full 100% value (from a global scale) would be that the project has the potential to remove emissions completely and a value of 0% (for this criterion) would be that if it does not reduce emissions in any way (as it is decided to not continue with projects which go against the program objective). Then using the bisectional model the stakeholders will decide when half the value is reduced, so where is the solution valued half as much as the complete emission reduction is valued. So if the stakeholder has to reach certain emission reductions, they would value a larger reduction far more than a small reduction, placing the halfway point closer to the 100% value. Then the same practice is done for the 75th and 25th quartile. Where the 75% value is given between the 50% and 100% marker, and the 25% value is given between the 0% and 50% using the same logic as previously. | ||
| + | Once these five points have been identified it is possible to sketch out the value function and then assign value to the alternatives based on the function. | ||
| + | |||
| + | ***A depiction of the value function example will be added here*** | ||
| + | |||
| + | '''The difference method''' | ||
| + | |||
| + | An alternative to the bisectional method is the difference method. Here the stakeholder is presented with a segment of the different values and has to rate them. Here the ranking will provide an idea of the value function, which can be sketched out. Using the example above, it is possible to use the difference model by taking the 0 CO2 emission and the current emission (lets say it is a 1 ton ) then using the difference method the difference between these would be segmented into a n categories. For simplicity’s sake it is here divided into four categories: 0-250 kg, 251-500 kg, 501-750 kg, and 751-1000 kg. Then the stakeholder will rate theses categories with an increase in value, lets say the larger the reduction the better, as they wish to be frontrunner, and reach their emission reduction targets. Then the stakeholder will rank the 751-1000 reduction as the most important, then the 501-750, the 251-500 and finally the 0-250 will be valued the least. | ||
| + | Once these preferences have been found it is possible to sketch out the value function and then assign value to the alternatives based on the function. | ||
| + | |||
| + | ***A depiction of the value function example will be added here*** | ||
| + | |||
| + | '''Scales''' | ||
| + | |||
| + | To assign value to a value function through the methods above it is necessary to define the scale. Once a scale has been defined it is possible to assign value to the alternatives, and later find the weights of each criterion to get the final value. There are two scales, local and global, the former is defined based on the current alternatives, while the other is based on a broader range of possible alternatives. | ||
| + | This means that the local scales outer boundaries are based on the best and worst performing alternatives, where the best will get a value of 100 and the worst will get a value of 0. Meanwhile the global scale will assign the best value to the best possible outcome, and the worst to the worst possible outcome. The global scale should for practical reasons only consider reasonable extremes. An example of the global scale could be the wish to reduce burning accidents, from a project stand point the best performance would then be a solution which ensured that no burns accidents could happen, while the worst performance would be a project which increased the current burning accidents, or which did not improve at all. | ||
| + | There are different benefits to both the local and global scale. The local scale allows for easier and quicker assessment of the alternatives and is beneficial if a rough estimation is fine for the criteria, and if time resources are limited. The global scale, while more time-consuming, is more generic, after creation it will be easier to access new alternatives. | ||
== Application == | == Application == | ||
Revision as of 18:35, 9 April 2023
Value functions are a value measurement approach that is often used in multi-criteria decision analysis (MCDA), which strives to improve decision-making. MCDA is a decision support tool used to assess solution alternatives based on a wide range of criteria, which can be both monetized and non-monetized. To assess the various criteria, value functions can be utilized to assign value to the various alternatives fairly. Value functions are thus a mathematical model that translates stakeholder preferences into a measurable scale.
Value functions are especially useful when comparing different choices (this can be solutions, projects, or other decision-related alternatives) as it converts the different choices, or evaluation criteria, into a common scale for a fair and less biased comparison as value functions assign a specific value to each solution alternative, creating a preferential structure. Consequently, value functions can assess various aspects of a solution and give a concrete value to each solution alternative to support a less biased decision basis.
As the tool can support various decision-makers in their choices, it can be used in all sorts of decisions, depending on how the function is defined. For use in portfolio management, the value function should be defined based on how well a given project meets the organization’s strategic goals. The project which performs best on the value function(s) will thus display the project that is most beneficial to the portfolio. Likewise, program managers can use value functions to identify projects which best fulfill the program’s objectives, to find the project that best balances competing demands and possible trade-offs, and to find the optimal project pool. Finally, it can be used in projects to find the best alternative solution or support the resources allocated to project activities.
This article gives an overview of what a value function is and a guide on constructing various value functions. There will also be a discussion on how and when to use value functions and their application in program, project, and portfolio management. Finally, this article will discuss some of the limitations of value functions and suggest alternative tools for when value functions are not applicable or practical.
Contents |
Value Functions
Value functions are a mathematical model which can translate stakeholder preferences and ideals into a less biased scale. Value functions should be used when the decision maker needs to choose a specific solution from a pool of solution alternatives. By creating a value function the decision maker will be able to identify the solution that will give the greatest reward. This is done by combining the indexes of all the alternatives into a measurable index of preferability. Value functions can be used to determine the value of a thing by looking at both tangible and intangible aspects. Thus, it properly evaluates all relevant aspects of a project, concept, or idea and their alternatives. A value function considers the value of a solution alternative on each of the criterions used in the decision basis. The primary function of the value function is to support the stakeholder in assigning value to each alternative, and then use the weight of each criterion to find the final benefit of the solution alternative. It should be noted that for each criterion a value function should be created. Value functions are useful when evaluating and comparing similar solution alternatives, as they assign a specific value to each solution alternative, creating a preferential structure. Often when evaluating a solution alternative or project several value functions are used, one for each of the performance criteria (also known as key performance indicators (KPIs) ). From these each solution alternative or projects performance can be assessed through the specific score/value that the solution alternative or project obtains on the value function scale. As value functions are a mathematical expression, they follow axioms, the most essential are that the preferences expressed by value functions should be coherent, thus they must be transitive and complete. This means that if project a is better then project b, and b is better then project c, then project a is better than c. It also means that either one project is better than the other or they are indifferent (project a is equally good as project b). Thus an alternative is only preferred to another alternative if its score on the value function is better than the other. If the scores are the same, then there will be indifference between the alternatives, meaning that they perform equally well.
Types of value functions
The most used value function model is the additive model:
Here V(a) refers to the total value of the solution alternative,  refers to the weight (the importance) of criteria i, and
  refers to the value of the criteria for the solution alternative. The additive model is easy to use, and especially easy for stakeholders to understand, making it the most used value function. In decision making it is essential that the stakeholder understands the process and thus the indicated solution preference. The additive model looks at each criterions impact on the complete value. It is also easy to change, add, and remove criteria from the model.
An alternative to the additive model is the multiplicative model:
The multiplicative model is harder for stakeholders to understand, however it better accounts for interdependencies between the criteria on the solution alternative. Thus it is better suited for finding an alternative which performs well on all criteria. This form of value function is best suited when the weights for each criteria is well known. Once a value type is decided upon there are various ways of creating the value function. Two of these are divulged here, the bisectional method and the difference method.
The bisectional method
The bisectional method is a direct method which needs input from the stakeholder. Here the stakeholder will identify the two end points of the value function, so the maximum and minimum value an attribute can have (this will depend on the chosen scale, see the scales section below). Then the stakeholder will identify where, between the two endpoints, the value is half, so when would the stakeholder consider a solution to have half the value of the maximum outcome. As an example, let’s consider a program where an objective is reducing emissions. When choosing a project for this program it is thus beneficial to consider how it contributes to the reduction of emissions. The full 100% value (from a global scale) would be that the project has the potential to remove emissions completely and a value of 0% (for this criterion) would be that if it does not reduce emissions in any way (as it is decided to not continue with projects which go against the program objective). Then using the bisectional model the stakeholders will decide when half the value is reduced, so where is the solution valued half as much as the complete emission reduction is valued. So if the stakeholder has to reach certain emission reductions, they would value a larger reduction far more than a small reduction, placing the halfway point closer to the 100% value. Then the same practice is done for the 75th and 25th quartile. Where the 75% value is given between the 50% and 100% marker, and the 25% value is given between the 0% and 50% using the same logic as previously. Once these five points have been identified it is possible to sketch out the value function and then assign value to the alternatives based on the function.
- A depiction of the value function example will be added here***
The difference method
An alternative to the bisectional method is the difference method. Here the stakeholder is presented with a segment of the different values and has to rate them. Here the ranking will provide an idea of the value function, which can be sketched out. Using the example above, it is possible to use the difference model by taking the 0 CO2 emission and the current emission (lets say it is a 1 ton ) then using the difference method the difference between these would be segmented into a n categories. For simplicity’s sake it is here divided into four categories: 0-250 kg, 251-500 kg, 501-750 kg, and 751-1000 kg. Then the stakeholder will rate theses categories with an increase in value, lets say the larger the reduction the better, as they wish to be frontrunner, and reach their emission reduction targets. Then the stakeholder will rank the 751-1000 reduction as the most important, then the 501-750, the 251-500 and finally the 0-250 will be valued the least. Once these preferences have been found it is possible to sketch out the value function and then assign value to the alternatives based on the function.
- A depiction of the value function example will be added here***
Scales
To assign value to a value function through the methods above it is necessary to define the scale. Once a scale has been defined it is possible to assign value to the alternatives, and later find the weights of each criterion to get the final value. There are two scales, local and global, the former is defined based on the current alternatives, while the other is based on a broader range of possible alternatives. This means that the local scales outer boundaries are based on the best and worst performing alternatives, where the best will get a value of 100 and the worst will get a value of 0. Meanwhile the global scale will assign the best value to the best possible outcome, and the worst to the worst possible outcome. The global scale should for practical reasons only consider reasonable extremes. An example of the global scale could be the wish to reduce burning accidents, from a project stand point the best performance would then be a solution which ensured that no burns accidents could happen, while the worst performance would be a project which increased the current burning accidents, or which did not improve at all. There are different benefits to both the local and global scale. The local scale allows for easier and quicker assessment of the alternatives and is beneficial if a rough estimation is fine for the criteria, and if time resources are limited. The global scale, while more time-consuming, is more generic, after creation it will be easier to access new alternatives.
Application
• Different creation methods (eliciting scores and weight for value functions)
• How to read and understand the value functions
• How to consult stakeholders and present the results (handling stakeholder input, handling stakeholder presentation) (often in decision making, the basis cannot be to complicated)
Limitation
• Stakeholder sensitivity
• Criteria selection
• Application limitations
Bibliography
von Winterfeldt, D., and Edwards, W. Decision Analysis and Behavioral Research. Cambridge University Press
Belton, V., and Stewart, J.T. Multiple criteria decision analysis: an integrated approach, Kluwer Academic Publishers, London.
Stewart, T. J. Use of Piecewise Linear Value Functions in Interactive Multicriteria Decision Support: A Monte Carlo Study. Management Science 39, pp. 1369-1381, Informs.
Stewart, T. J. Robustness of Additive Value Function Methods in MCDM. Journal of Multi-Criteria Decision Analysis 5, pp. 301-309, Wiley.