Critical Path Method in a Gantt Chart
(→Implementation) |
(→Implementation) |
||
| Line 94: | Line 94: | ||
| − | [[File:Gantt Chart Example.png| | + | [[File:Gantt Chart Example.png|1000px|thumb|center|Figure 5: Implementation of the Gantt Chart]] |
==Critical Path Method (CPM) in Gantt Chart== | ==Critical Path Method (CPM) in Gantt Chart== | ||
Revision as of 15:09, 5 May 2023
Contents |
Abstract
Scheduling a project is one of the main challenges in project management. According to ISO21502 the purpose of schedule management is to enable work to be undertaken in a timely manner and to reduce slippage to an acceptable level. The schedule should be an integrated part of the project’s plan and developed under the direction of the project manager[1] .
There are several scheduling techniques that can be used to plan and estimate the duration of a project according to its complexity and uncertainty. One of the most common is the critical path method or CPM. This scheduling tool calculates the theoretical early and late start and finish dates for all activities, with no resource constraints, performing a bottom-up analysis forward and backward the entire network [2]. The “critical path” is the longest sequence of activities that must finish in time to fully complete the project. However, it also determines the shortest period in which the project can be finished.
One of the benefits of using this tool is that allows to identify the most critical activities of the project, which helps project managers to have a good overview in which task they must put more focus on.
Additionally, this article will explain how the CPM can be combined with other scheduling techniques, in particular with the well-known Gantt Chart.
History of The Critical Path Method (CPM)
During the early 1950s the traditional project management approach started to fail due to the complexity of coordinate multiples activities in the direction of the same project objective. Hence, the development of a tool that was able to organize the sequence of activities and schedule them was needed. The critical path method or CPM was developed in the 1950s by two engineers, Morgan R. Walker, working for the DuPont Corporation, and James E. Kelly working for Remington Rand. The development of this tool has its foundations on the work of DuPont Corporation from the earlier 1940s in the so recognized Manhattan Project.[3]
Large building projects like the development of chemical and nuclear power facilities were the first ones to apply the critical route technique. Although it swiftly found uses in a variety of sectors, including as software development, manufacturing, and services. The 1960s and 1970s saw a significant increase in the use of CPM as a tool for managing big and complex projects. It was especially helpful for projects that called for the coordination of several interdependent activities as well as resources and timelines.
CPM is still often employed in project management today and is included in several project management software programs. The tool has also been modified to consider modifications in project management procedures, such as the expanding usage of Agile approaches and virtual teams.
Implementation of CPM
Step 1: List the activities and identify their dependencies.
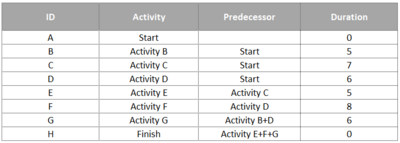
The first step is to use a work breakdown structure (WBS) to list the activities of the project, set their duration and dependency as it can be seen in figure 1. This information set the base for creating the network diagram, which is the next step in the CPM process.
Step 2: Creates the network diagram.
When the list of activities is created and all critical tasks are identified, the next step is to creates the network diagram. The precedence diagram method or PDM is commonly used for this purpose. PMBOK (Project Management Body of Knowledge) describes it as a tool that uses rectangles, referred to as nodes, to represent activities, and connect them with arrows that show the logical relationships that exist between them. [4] . There are four types of relationships between activities:
• Finish-to-Start (FS): A task cannot start before its predecessor finishes.
• Start-to-Start (SS): A task cannot start before its predecessor start.
• Finish-to-Finish (FF): When both activities must finish at the same time.
• Start-to-Finish (SF): A task cannot start until another task finishes.
Step 3: Estimates the activities duration and calculate the critical path.
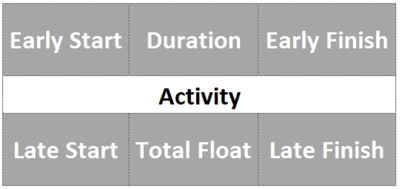
To start this stage certain definitions must be made [5]:
• Early Start (ES): It’s determined by the early finish (EF) of its predecessor.
• Early Finish (EF): It’s the early start (ES) plus the duration of the task.
• Latest Finish (LF): It’s the latest time that the activity can be completed or the lowest late start of its successor.
• Latest Start (LS): The latest time that its predecessor needs to finish or the latest finish (LF) minus the duration.
• Float or slack: The amount of time that each activity can be delayed with out delaying the final delivery date of the project.
Figure 3 shows how they can be display into the network diagram to calculate the critical path.
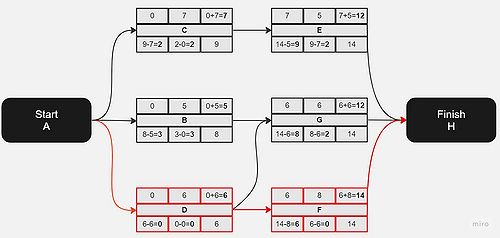
As it was mentioned in Abstract, the way of estimates the task durations is by applying the forward and backward pass techniques. The forward technique calculates the early start and early finish of each task. starting with task number one set to an early start of 0 and continuing until the last task is scheduled. On the other hand, the backward technique works in the opposite direction, starting with the latest finish of the last activity being as its early finish. Furthermore, the latest finish of each preceding task will be the lowest latest start of its successors. Finally, the latest start of each task will be calculated by subtracting the duration to its latest finish.
The final date of the project will be the early finish of the last task. (See figure 4)
Step 4: Identify the float.
The final step is to calculate the float of each activity. This will help to identify how much a specific task can be delayed without delaying the final date of the project. In other words, it shows the flexibility that the project has.
Critical activities don’t have float, or have zero float, which means that they cannot be delayed. This sequence of tasks creates the critical path (Sequence of activities marked in red in figure 4). The ‘’’total float’’’ can be calculated by the formula: Latest Start (LS) - Early Start (ES). [6]
Identifying the float is beneficial to project managers because it helps understand in which activities they must focus the resources on, and which ones can be delayed (if necessary) in order to complete the project on time.
Gantt Chart
History and definition
The Gantt Chart is a scheduling tool that is illustrated in a horizontal bar chart. It contains the different activities of a project, with their respective duration and responsible. It also includes the dependencies between tasks.
Henry Gantt developed it in early 1900s as a production planning tool. He wanted to visualize the production schedule of a manufacturing plant. He based his study on previous charts that were used to schedule different projects. It became more popular during World War I as a tool to schedule the production of military equipment. [7]
Nowadays, it is one of the most popular project management tools as it is even more accessible to project managers thanks to the numerous software tools that have been created over the years to construct and manage them.
Implementation
Gantt chart is a very powerful tool, yet easy to use. The first step is to identify all tasks requires to complete the project. Then, define their start and end dates, and their dependencies of each other. Finally, assign each task to a team member, who is going to be responsible for the fulfillment of this one.
Following the creation of the list, it is time to elaborate the chart. All activities are listed on the vertical axis, and the dates on the horizontal axis.
Critical Path Method (CPM) in Gantt Chart
Most of the time, different scheduling techniques are used individually, however this section explains the benefits of combining the two methods mentioned earlier to achieve more accurate results. By merging the CPM and the Gantt chart, the strengths of each can be maximized to improve the overall outcomes.
Step 1: The activities
As it was mentioned before, on the Gantt chart section, the first step is to list all the activities.
Limitations and Critical Chain Method
Conclusion
See also
Bibliography
A Guide to the Project Management Body of Knowledge, fourth edition, 2008, Project Management Institute:
The book was an important source of information for writing this wiki article. It is recognized as a reference for project management all around the world, and it helped to understand how CPM works and how to implement it. The insights provided by the book were essential in writing an informed article that can help other people in the implementation of this tool.
The origins of CPM: a personal history. PM Network, 1989, Kelley, J. E., Walker, M. R., & Sayer, J. S. :
This book was very useful to understand the creation and evolution of CPM. It provided historical data, and detailed aspects of its development as the writer J. Kelley was directly involved in it.
Critical-Path Planning and Scheduling, 1959, James E. Kelly & Morgan R. Walker:
This book offers helpful guidance on how to implement CPM. Moreover, it helped to understand the essential components giving examples of different projects where the tool was effectively implemented.
References
- ↑ Project, programme and portfolio management — Guidance on project management, 2020, International Standar, pp.32
- ↑ A Guide to the Project Management Body of Knowledge, fourth edition, 2008, Project Management Institute, pp.154
- ↑ Critical-Path Planning and Scheduling, 1959, James E. Kelly & Morgan R. Walker, pp.160-161
- ↑ A Guide to the Project Management Body of Knowledge, fourth edition, 2008, Project Management Institute, pp.154
- ↑ A Guide to the Project Management Body of Knowledge, fourth edition, 2008, Project Management Institute, pp.138
- ↑ A Guide to the Project Management Body of Knowledge, fourth edition, 2008, Project Management Institute, pp.155
- ↑ Gantt charts: A centenary appreciation, 2003, James M. Wilson, pp.430-431


