Risk matrix: Difference between revisions
No edit summary |
No edit summary |
||
| Line 1: | Line 1: | ||
This article is an overview and summary of the graphical tool called Risk Matrix concerning risk assessment in Project Management. | This article is an overview and summary of the graphical tool called Risk Matrix concerning risk assessment in Project Management. | ||
== | ==Introduction== | ||
To successfully execute its projects, especially in surrounding unstable environment, the companies, have to be aware about uncertainty with coming risks that might appear and affect on the | To successfully execute its projects, especially in surrounding unstable environment, the companies, have to be aware about uncertainty with coming risks that might appear and affect on the outcome during different stages of project. Effective project management need to identify what types of risk can influence particular stage of project, prioritize risks in terms of most severity and perform decision making in order to avoid any harm that may cause particular risk. | ||
The one of the useful risk assessment tool that support managerial decision making in terms of which risk need to be considered first is called “Risk Matrix” or also known as “Probability and Impact Matrix”. | |||
'''Risk Matrix'''('''Probability and Impact Matrix''') is a graphical tool used during Project Management, in particularly Risk Assessment, to define the different levels of risk as the product of the harm probability categories and harm severity categories. <ref name="ISO10"> [''Risk Management - Risk assessment techniques''] ''Dansk Standart DS/EN ISO 31010, 2010'' </ref> | |||
The aim of this very effective tool is to visualize and prioritize risks of adverse events and assist management to perform decision making which certain risks can be tolerated or not. <ref name="Nijs"> [''Recommendation on the use and design of risk matrices'] Nijs Jan Duijm, Safety Science 76, p.21-31, DTU, 2015 </ref> | |||
==Definition of risk matrix== | |||
According to ISO 31000 <ref name="ISO09"> [''Risk Management – Principles and Guidelines''] ''Dansk Standart DS/EN ISO 31000, 2009'' </ref>the definition of Risk is outlined as combination of two basis criteria: | |||
1. The consequences or the severity of the impact of an adverse event caused by the risk. | |||
2. The probability or likelihood that this event may occur | |||
In its turn the level of risk or expected loss is defined as multiplication of these two criteria | |||
Level of Risk=Probability x Consequence | |||
In order to classify or rank the risks on the basis of its criteria the risk matrix need to be created as two-dimension grid with consequence/impact on one axis (commonly Y-axis) and probability or likelihood on the other (X-axis) as shown on figure 1. | |||
[[File:rm2.jpg]] | |||
Figure 1. Risk Matrix | |||
The output of risk matrix is defined as a ranked list of risk placed into risk matrix according to assigned consequence and probability as shown on figure 2 | |||
[[File:rm1.png]] | |||
Figure 1. Risk Matrix | |||
Likelihood of Occurrence | |||
Based on the likelihood of the occurrence of a risk the risks can be classified under one of the five categories: | |||
1. Definite: A risk that is almost certain to show-up during project execution. If you’re looking at percentages a risk that is more than 80% likely to cause problems will fall under this category. | |||
2. Likely: Risks that have 60-80% chances of occurrence can be grouped as likely. | |||
3. Occasional: Risks which have a near 50/50 probability of occurrence. | |||
4. Seldom: Risks that have a low probability of occurrence but still can not be ruled out completely. | |||
5. Unlikely: Rare and exceptional risks which have a less than 10% chance of occurrence. | |||
Consequences | |||
The consequences of a risk can again be ranked and classified into one of the five categories, based on how severe the damage can be. | |||
1. Insignificant: Risks that will cause a near negligible amount of damage to the overall progress of the project. | |||
2. Marginal: If a risk will result in some damage, but the extent of damage is not too significant and is not likely to make much of a difference to the overall progress of the project. | |||
3. Moderate: Risks which do not impose a great threat, but yet a sizable damage can be classified as moderate. | |||
4. Critical: Risks with significantly large consequences which can lead to a great amount of loss are classified as critical. | |||
5. Catastrophic: These are the risks which can make the project completely unproductive and unfruitful, and must be a top priority during risk management. | |||
A risk matrices are common used to rank risks, sources of risks or risks treatments on the basis of the level of risk. It is commonly used as a screening tool when many risks have been already identified, for example to define which need to be referred to a higher level of management. | A risk matrices are common used to rank risks, sources of risks or risks treatments on the basis of the level of risk. It is commonly used as a screening tool when many risks have been already identified, for example to define which need to be referred to a higher level of management. | ||
| Line 19: | Line 55: | ||
The Risk matrices may also be used to help communicate a common understanding foe qualitative levels of risks across the organization. The way risk levels are set and decision rules assigned to them should be aligned with the organization´s risk appetite. | The Risk matrices may also be used to help communicate a common understanding foe qualitative levels of risks across the organization. The way risk levels are set and decision rules assigned to them should be aligned with the organization´s risk appetite. | ||
==Application and use == | |||
1. '''Application''' | |||
‘Risk matrices have two main applications. The application or aim of the risk matrix is relevant when discussing the suitability of risk matrices. One application is decision-making about the acceptance of risk; the other is to prioritize which risk needs to be addressed first. | |||
Frequently, in risk acceptance, only three levels of risk are distinguished: | Frequently, in risk acceptance, only three levels of risk are distinguished: | ||
| Line 39: | Line 74: | ||
In cases where the risk matrix is used for prioritizing (which hazards require most attention in order to reduce the cumulative risk), a larger number of risk levels may be necessary in order to obtain sufficient resolution to rank events or hazards in order of priority. Even then, different hazards may end up either in the same cell or with the same assigned risk (so called risk ties, see (Ni et al., 2010). | In cases where the risk matrix is used for prioritizing (which hazards require most attention in order to reduce the cumulative risk), a larger number of risk levels may be necessary in order to obtain sufficient resolution to rank events or hazards in order of priority. Even then, different hazards may end up either in the same cell or with the same assigned risk (so called risk ties, see (Ni et al., 2010). | ||
''' | 2. '''Use''' | ||
To use the Risk Impact/Probability Chart, print this free worksheet, and then follow these steps: | |||
1. List all of the likely risks that your project faces. Make the list as comprehensive as possible. | |||
2. Assess the probability of each risk occurring, and assign it a rating. For example, you could use a scale of 1 to 10. Assign a score of 1 when a risk is extremely unlikely to occur, and use a score of 10 when the risk is extremely likely to occur. | |||
3. Estimate the impact on the project if the risk occurs. Again, do this for each and every risk on your list. Using your 1-10 scale, assign it a 1 for little impact and a 10 for a huge, catastrophic impact. | |||
4. Map out the ratings on the Risk Impact/Probability Chart. | |||
5. Develop a response to each risk, according to its position in the chart. Remember, risks in the bottom left corner can often be ignored, while those in the top right corner need a great deal of time and attention. Read Risk Analysis and Risk Management for detailed strategies on developing a risk response plan. | |||
To rank risks, the user first finds the consequence descriptor that best fits situation then defines the probability with which those consequences will occur. The level of risk is read from the matrix. | |||
==Limitations== | ==Limitations== | ||
| Line 77: | Line 112: | ||
http://www.cgerisk.com/knowledge-base/risk-assessment/risk-matrices | |||
http://www.brighthubpm.com/risk-management/88566-tool-for-assessing-project-risk/#imgn_0 | |||
https://www.mindtools.com/pages/article/newPPM_78.htm | |||
http://blog.etq.com/bid/57768/Risk-Assessment-Creating-a-Risk-Matrix | |||
http://www.brighthubpm.com/risk-management/96973-keeping-track-of-risks-with-a-project-risk-matrix/ | |||
http://www.brighthubpm.com/risk-management/96973-keeping-track-of-risks-with-a-project-risk-matrix/ | |||
http://www.brighthubpm.com/templates-forms/104889-using-a-probability-and-impact-matrix-for-project-risk-management/ | |||
Revision as of 14:20, 16 September 2016
This article is an overview and summary of the graphical tool called Risk Matrix concerning risk assessment in Project Management.
Introduction
To successfully execute its projects, especially in surrounding unstable environment, the companies, have to be aware about uncertainty with coming risks that might appear and affect on the outcome during different stages of project. Effective project management need to identify what types of risk can influence particular stage of project, prioritize risks in terms of most severity and perform decision making in order to avoid any harm that may cause particular risk.
The one of the useful risk assessment tool that support managerial decision making in terms of which risk need to be considered first is called “Risk Matrix” or also known as “Probability and Impact Matrix”.
Risk Matrix(Probability and Impact Matrix) is a graphical tool used during Project Management, in particularly Risk Assessment, to define the different levels of risk as the product of the harm probability categories and harm severity categories. [1]
The aim of this very effective tool is to visualize and prioritize risks of adverse events and assist management to perform decision making which certain risks can be tolerated or not. [2]
Definition of risk matrix
According to ISO 31000 [3]the definition of Risk is outlined as combination of two basis criteria: 1. The consequences or the severity of the impact of an adverse event caused by the risk. 2. The probability or likelihood that this event may occur In its turn the level of risk or expected loss is defined as multiplication of these two criteria Level of Risk=Probability x Consequence In order to classify or rank the risks on the basis of its criteria the risk matrix need to be created as two-dimension grid with consequence/impact on one axis (commonly Y-axis) and probability or likelihood on the other (X-axis) as shown on figure 1.
 Figure 1. Risk Matrix
The output of risk matrix is defined as a ranked list of risk placed into risk matrix according to assigned consequence and probability as shown on figure 2
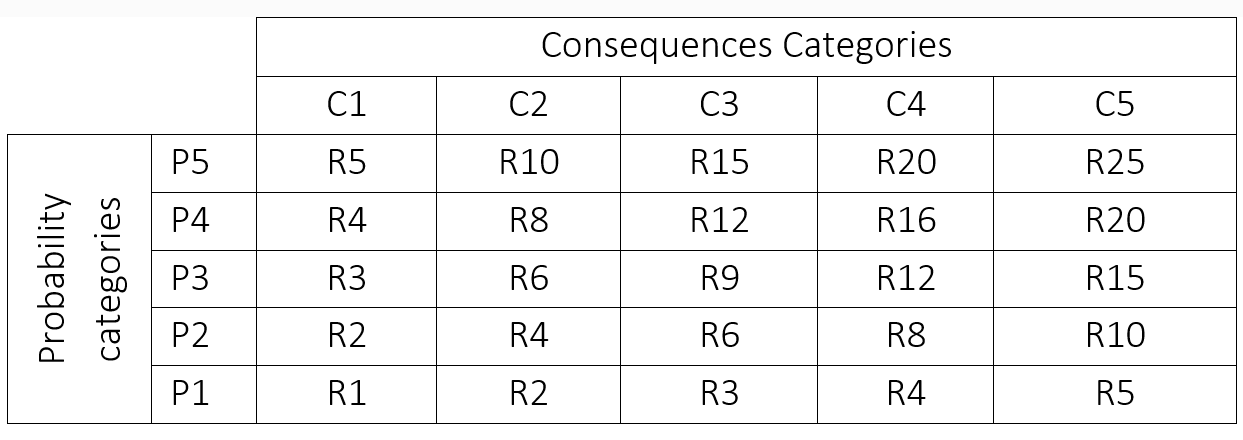

Figure 1. Risk Matrix
Likelihood of Occurrence
Based on the likelihood of the occurrence of a risk the risks can be classified under one of the five categories:
1. Definite: A risk that is almost certain to show-up during project execution. If you’re looking at percentages a risk that is more than 80% likely to cause problems will fall under this category.
2. Likely: Risks that have 60-80% chances of occurrence can be grouped as likely.
3. Occasional: Risks which have a near 50/50 probability of occurrence.
4. Seldom: Risks that have a low probability of occurrence but still can not be ruled out completely.
5. Unlikely: Rare and exceptional risks which have a less than 10% chance of occurrence.
Consequences
The consequences of a risk can again be ranked and classified into one of the five categories, based on how severe the damage can be.
1. Insignificant: Risks that will cause a near negligible amount of damage to the overall progress of the project.
2. Marginal: If a risk will result in some damage, but the extent of damage is not too significant and is not likely to make much of a difference to the overall progress of the project.
3. Moderate: Risks which do not impose a great threat, but yet a sizable damage can be classified as moderate.
4. Critical: Risks with significantly large consequences which can lead to a great amount of loss are classified as critical.
5. Catastrophic: These are the risks which can make the project completely unproductive and unfruitful, and must be a top priority during risk management.
A risk matrices are common used to rank risks, sources of risks or risks treatments on the basis of the level of risk. It is commonly used as a screening tool when many risks have been already identified, for example to define which need to be referred to a higher level of management. It may also be used to select which risks need to be considered further at this time. This kind of risk matrices are also wide used to determine if a given risk is broadly acceptable, or not acceptable according to the zone where it is located on the matrix.
The Risk matrices may also be used to help communicate a common understanding foe qualitative levels of risks across the organization. The way risk levels are set and decision rules assigned to them should be aligned with the organization´s risk appetite.
Application and use
1. Application
‘Risk matrices have two main applications. The application or aim of the risk matrix is relevant when discussing the suitability of risk matrices. One application is decision-making about the acceptance of risk; the other is to prioritize which risk needs to be addressed first.
Frequently, in risk acceptance, only three levels of risk are distinguished:
- hazards or events with unacceptable risk (often indicated with a red color);
- hazards or events in which the risk is found to be ‘‘broadly acceptable’’, i.e. not requiring further risk reduction (often indicated with green),
- an intermediate level, where risk should be reduced ‘‘As Low As Reasonably Practicable’’ (ALARP, often indicated with yellow).
Given these interpretations, there is no need to further prioritize hazards, at least not in the red and green areas.
In cases where the risk matrix is used for prioritizing (which hazards require most attention in order to reduce the cumulative risk), a larger number of risk levels may be necessary in order to obtain sufficient resolution to rank events or hazards in order of priority. Even then, different hazards may end up either in the same cell or with the same assigned risk (so called risk ties, see (Ni et al., 2010).
2. Use To use the Risk Impact/Probability Chart, print this free worksheet, and then follow these steps: 1. List all of the likely risks that your project faces. Make the list as comprehensive as possible. 2. Assess the probability of each risk occurring, and assign it a rating. For example, you could use a scale of 1 to 10. Assign a score of 1 when a risk is extremely unlikely to occur, and use a score of 10 when the risk is extremely likely to occur. 3. Estimate the impact on the project if the risk occurs. Again, do this for each and every risk on your list. Using your 1-10 scale, assign it a 1 for little impact and a 10 for a huge, catastrophic impact. 4. Map out the ratings on the Risk Impact/Probability Chart. 5. Develop a response to each risk, according to its position in the chart. Remember, risks in the bottom left corner can often be ignored, while those in the top right corner need a great deal of time and attention. Read Risk Analysis and Risk Management for detailed strategies on developing a risk response plan.
To rank risks, the user first finds the consequence descriptor that best fits situation then defines the probability with which those consequences will occur. The level of risk is read from the matrix.
Limitations
The aim of any risk evaluation tool is to ensure that the decision process is transparent, based on best knowledge and reflects the common understanding of stakeholders. When reviewing the application of risk matrices, it becomes obvious that this simple tool has some notable weaknesses. Both users and designers of risk matrices should be aware of these shortcomings and ensure that the risk matrices are used in such a way that correct conclusions are drawn.
The mentioned ISO 31010 (2010) also includes an invaluable summary of the advantages and disadvantages of risk matrices, together with recommendations for their usage.
Strengths:
- relatively easy to use;
- provides a rapid ranking of risks into different significance levels.
Limitations:
- a matrix should be designed to be appropriate for the circumstances so it may be difficult to have a common system applying across the range of circumstances relevant to an organization;
- it is difficult to define the scales unambiguously;
- use is very subjective and there tend to be significant variation between raters;
- risk can not be aggregated (i.e. one cannot define that a particular number of low risks or a low risk identified a particular number of ties is equivalent to a medium risk);
- it is difficult to combine or compare the level of risk for the different categories of consequences(impact)
Results will depend of the level of detail of the analysis, i.e. the more detailed the analysis the higher the number of scenarios, each with a lower probability. This will underestimate the actual level of risk. The way in which scenarios are grouped together in describing risk should be consistent and defined at the start of the study.
http://www.cgerisk.com/knowledge-base/risk-assessment/risk-matrices
http://www.brighthubpm.com/risk-management/88566-tool-for-assessing-project-risk/#imgn_0
https://www.mindtools.com/pages/article/newPPM_78.htm
http://blog.etq.com/bid/57768/Risk-Assessment-Creating-a-Risk-Matrix
http://www.brighthubpm.com/risk-management/96973-keeping-track-of-risks-with-a-project-risk-matrix/
http://www.brighthubpm.com/risk-management/96973-keeping-track-of-risks-with-a-project-risk-matrix/
http://www.brighthubpm.com/templates-forms/104889-using-a-probability-and-impact-matrix-for-project-risk-management/