Fault Tree Analysis in Projects
| Line 1: | Line 1: | ||
'''Fault tree analysis (FTA)''' is defined by the [[International Electrotechnical Commission|International Electrotechnical Commission (IEC)]] and the [[International Organization for Standardization|International Organization for Standardization (ISO)]] as a "technique for identifying and analysing factors that can contribute to a specified undesired event".<ref name="ds" /> | '''Fault tree analysis (FTA)''' is defined by the [[International Electrotechnical Commission|International Electrotechnical Commission (IEC)]] and the [[International Organization for Standardization|International Organization for Standardization (ISO)]] as a "technique for identifying and analysing factors that can contribute to a specified undesired event".<ref name="ds" /> | ||
| − | FTA has its wide range of application in many fields of engineering such as [[systems engineering]], [[reliability engineering]], and [[safety engineering]]. It also serves as an applicable tool for identifying the causes of undesired events in projects. | + | FTA has its wide range of application in many fields of engineering such as [[systems engineering]], [[reliability engineering]], and [[safety engineering]]. It also serves as an applicable tool for identifying the causes of undesired events in projects. Undesired events in projects can for instance be exceeding the budget, time delays, lack of team synergy, or any other events that have a negative effect on the project. This is referred to as the top event. |
The purpose of FTA is to give both a qualitative and quantitative analysis of the factors that can trigger the undesired top event. A qualitative analysis shows via a graphical representation of a tree the top event that is to be analysed, along with the pathway of all the intermediate and basic events that leads up to the top event. A quantitative analysis shows the probability of a top event being triggered by the input probabilities of the basic events that leads up to the undesired event. The quantitative analysis is calculated through [[Boolean algebra]].<ref name="silvianita" /> | The purpose of FTA is to give both a qualitative and quantitative analysis of the factors that can trigger the undesired top event. A qualitative analysis shows via a graphical representation of a tree the top event that is to be analysed, along with the pathway of all the intermediate and basic events that leads up to the top event. A quantitative analysis shows the probability of a top event being triggered by the input probabilities of the basic events that leads up to the undesired event. The quantitative analysis is calculated through [[Boolean algebra]].<ref name="silvianita" /> | ||
Revision as of 18:50, 16 September 2016
Fault tree analysis (FTA) is defined by the International Electrotechnical Commission (IEC) and the International Organization for Standardization (ISO) as a "technique for identifying and analysing factors that can contribute to a specified undesired event".[1]
FTA has its wide range of application in many fields of engineering such as systems engineering, reliability engineering, and safety engineering. It also serves as an applicable tool for identifying the causes of undesired events in projects. Undesired events in projects can for instance be exceeding the budget, time delays, lack of team synergy, or any other events that have a negative effect on the project. This is referred to as the top event.
The purpose of FTA is to give both a qualitative and quantitative analysis of the factors that can trigger the undesired top event. A qualitative analysis shows via a graphical representation of a tree the top event that is to be analysed, along with the pathway of all the intermediate and basic events that leads up to the top event. A quantitative analysis shows the probability of a top event being triggered by the input probabilities of the basic events that leads up to the undesired event. The quantitative analysis is calculated through Boolean algebra.[2]
Contents |
History
Methodology
FTA is based on the analysis of a top event. This is an event that is believed to be of great importance to the project or an event which has not been given enough attention. A top event needs to be defined as a failure, as it is an undesired event that is to be avoided. Examples of such events can be the delayal of the project if time is considered a constraint. Other projects may be funded by a tight budget where it is crucial to stay within the budget's limits, therefore a top event could be failure to meet the expected budget. Only one top event can be chosen for each fault tree, however it is often recommended to develop several fault trees[citation] each with their different top events if the project is of a large scale or if several top events are of great importance, such as the safety in a powerplant.
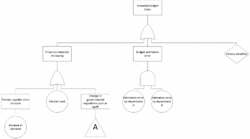
Once a top event has been chosen, the causal factors for said event needs to be identified. Figure 1 is a representation of a basic fault tree with "Exceeded budget limits" as the top event. Beneath it all the causal factors located, that may trigger the top event. The graphical illustration of the fault tree consists of symbols with the intended purpose of clarifying the different relations between the different causal factors.
Symbols
Boolean algebra
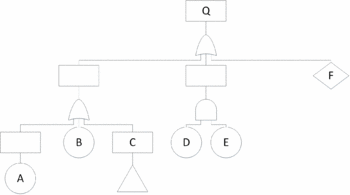
Boolean algebra can be used for a quantitative analysis of a fault tree. By using Boolean algebra, it is possible to calculate the probability of different events, as well as the top event to occur. Figure 2 is the same fault tree as the previous fault tree in Figure 1, and all of the base events have been assigned a letter to identify them, with the assumption that the events governmental regulations and penalties are also base events. The top event is furthermore assigned the letter Q. For the quantitative analysis only the base events are of interest because they are the lowest causal factors, therefore the intermediate causal factors are of no importance to the analysis and are left blank.
OR gates denote a sum because the base events do not depend on each other while AND gates denote a product because the base events depend on each other. The algebraic representation of the fault tree thus becomes:
Which can be rewritten as:
If the probabilities of the base events are known, it is then possible to calculate the probability for the top event, Q, to occur. Based on the equation from Boolean algebra, it is possible to find the different paths that can occur in the fault tree for the top event to occur. These different paths are referred to as cut sets.[3] For instance if base event A occurs, then the top event will be triggered. The same goes for base events B, C, and F. However failure on base event D does not trigger the top event due to the AND gate, therefore a possible cut set with base event D would be DE as it requires base event E to occur as well. It is especially interesting in the case of a fault tree analysis to look at minimal cut sets, which are defined as the minimal amount of combinations of the base events that can cause the failure of the top event.[3]
Application
Risks will always be a part of projects, and the need to identify the risks and the impact they can have on projects can be crucial for the success of the project management. In general, FTA can be broken down into 3 steps when applying it to a project:[4]
- Defining the top event that is to be analysed.
- Constructing the fault tree with all the associated events that can lead up to the top event along with their appropriate gates to describe their relations. It is important that the lowest level of events (base events) have been identified as single tasks[4] where further analysis of said events would be deemed unnecessary for the overall analysis of the fault tree.
- Calculating the probability of the top event occurring by using Boolean algebra, in order to assess the reliability of the fault tree.
For some projects it may not be necessary to execute step 3 if the focus is only to identify the risks and their dependencies with each other or if the team is unable to obtain the probabilities for the different base events. Calculating the probability for the top event to occur is however crucial in many projects and will indicate whether a project is not reliable and has a high likelihood of failing. In case the fault tree analysis indicates that there is a high probability of failure, the team may want to reorganize the project’s logic or structure in order to make it more reliable.[4]
In order to successfully apply FTA to a project, the project needs to be clearly defined in terms of the goals and success criterias. A project can be described by three variables that are to be measured: Budget/money spent, Timeframe/time used, or Quality which assesses the different goals in the project.[4] Top events that are used in fault trees during project management will always relate to one of these three variables. While time and budget related top events are easy to measure, quality or performance related top events can be much more difficult. Performance related top events can be any type of event that doesn’t relate to time or budget, and is a way to measure the success or failure of the project based on bad performance or bad quality of deliverables.[4] Since it is difficult to measure performance, it is very important that the success criterias have been defined from the beginning and there is a clear definition on what type of performance and/or quality that is deemed acceptable within the project.[4]
Identifying the risks related to the project is of crucial importance, and the more thorough the risk identification is, the more detailed and insightful the fault tree becomes. Risk identification includes many different methods such as evidence based methods (i.e. historical data) or inductive reasoning techniques such as Hazard and operability study (HAZOP).[1] For the quantitative analysis, the probabilities of each of the identified risks need to be estimated in order to apply Boolean algebra and calculate the overall risk of the top event occurring. Some events can be based on evidence and other data such as market analyses that can estimate the probability of a shortage on a certain material. Other events are based on human activities such as budget estimation errors, which are much more difficult to estimate. Various methods exist that can be used to estimate human activity errors, such as technique for human error rate prediction (THERP) or performance shaping factors (PSFs).[4]
minimal cut sets[5]
Example
Strengths and weaknesses
Limitations
See also
Annotated bibliography
- ↑ 1.0 1.1 IEC/ISO 31010, "Risk management - Risk assessment techniques", 2009
- ↑ Silvianita, Dirgha S Mahandeka, Daniel M Rosyid, "Fault Tree Analysis for Investigation on the Causes of Project Problems", 2015
- ↑ 3.0 3.1 | weibull.com - Reliability Engineering Resource Website Retrieved: September 16, 2016
- ↑ 4.0 4.1 4.2 4.3 4.4 4.5 4.6 Marcin Krysinski, and George Anders, "Fault Tree Analysis in a Project Context", 2005
- ↑ Robert Beresh, John Ciufo, and George Anders, "Basic Fault Tree Analysis for use in Protection Reliability", 2009


