Understand best practices based on network mapping
(→Methodology: Network visualization and analysis) |
(→Network size) |
||
| Line 26: | Line 26: | ||
Network size can be defined as the total number of nodes in the network. | Network size can be defined as the total number of nodes in the network. | ||
| − | Connectivity | + | ====Connectivity==== |
| + | If all nodes in a network are connected and can reach to all nodes in the network by a path, the network can be defined as connected. | ||
| − | Cluster | + | ====Cluster==== |
| + | This is a set of nodes that are strongly connected in the network and placed close to each other. | ||
| − | Distance | + | ====Distance==== |
| + | Is defined as the number of nodes you have to get passed to reach to another node, by that path length. | ||
| − | Centrality | + | ====Centrality==== |
| + | This is defined as a group of nodes or individual nodes which has a strong influence and importance for the network. | ||
| − | Degree centrality | + | ====Degree centrality==== |
| + | The node with the highest number of edges connected directly to it. | ||
Revision as of 20:09, 26 September 2016
Contents |
Abstract
Project management has grown, from something that some companies uses to some extend when they operate their businesses, to something that all company uses. But as it is a growing business model to use, companies seems to to find the best way to manage projects to be challenging. Project can be small, simple and unpaid projects to big, complex and expensive projects. But even though all kind of materials exists on what the best techniques, process and methods for project management are, project management are still difficult to manage. This wiki will describe how project management practices can be visualised as a network and how network mapping can be used to determine “best practices of project management”. By analysing a groups of danish project managers and their choices of tools when they practice project management shows that some
Methodology: Network visualization and analysis
Network visualization has its origin from social studies which the latest years has had a growth in the studies of complex connectedness of modern society. Network perspectives are used to simplify the complex network in models which helps diagnose possible issues and prevent potential problems. Furthermore network mapping reveals unknown relationships between objects in the networks.
A network consist of objects, which in network theory is called nodes.These nodes may be connected, but not all nodes in a network are. The connections between nodes in the network is called edges or links. These edges describe the relationship between the objects and depended on how these edges are drawn, the edges can have different meanings in the network. The total network which is all edges and nodes, is in network theory called a graph. This graph can have different meanings and can be visualized differently even though the graph contains the same set of edges and nodes. A graph usually shapes from definitions defined by oneself. It can be shaped dependent on a set of factors which can be connectivity, modularity, centrality, network size etc. These factors are some of the key features, to look at, when you try to analyse and understand complex networks. A few of these key features will be listed below with short definitions.
Network size
Network size can be defined as the total number of nodes in the network.
Connectivity
If all nodes in a network are connected and can reach to all nodes in the network by a path, the network can be defined as connected.
Cluster
This is a set of nodes that are strongly connected in the network and placed close to each other.
Distance
Is defined as the number of nodes you have to get passed to reach to another node, by that path length.
Centrality
This is defined as a group of nodes or individual nodes which has a strong influence and importance for the network.
Degree centrality
The node with the highest number of edges connected directly to it.
All these key features can be used to analyse and understand complex networks, in all kind of studies and can be applied when it comes to the study of project management
Definition of Best practice of project management
A best practise of project management are set of general techniques, processes and methods that more effective can give you the desired outcomes of a project than others. But moreover it is also a standardised tool that repeatedly has been proven as the best standard to be used, independent on project type, size etc. Theory says that there are four main reasons to capturing best practices Improve efficiency Improve effectiveness Standardisations Consistency One or more of these definitions should be recognised when a company look for there best practices.
Several standards as PMI, IPMA, ISO 21500 and PRINCE2 has tried to create guidelines, explaining best practices of project management. Some of these standards has a common project cycle which they follow. These cycles represents a project from its beginning to the end. PRICE2 describes a project with 7 phases listed below.
1) Starting up a project
2) Directing a project
3) Initiating a project
4) Managing stage boundaries
5) Controlling a stage
6) Managing product delivery
7) Closing a project
Some of these phases runs during the whole project and some only doing parts. But if the phases from PRINCE2 gets compared to PMI which only has 5 phases, it gets clear that there are some similarities. PMI has the following phases which they follow.
1) Initiating
2) Planning
3) Executing
4) Monitoring and controlling
5) Closing
ISO21500
Another commonly used standard, the ISO21500 has as PMI and PRINCE2 developed a set of guidelines that explaining central concepts and processes in project management. The ISO21500 standards has aimed to create a guideline that independent on type, industry, complexity and size. The ISO21500 standard consist of 39 project management processes divided into 10 subject groups and as PMI and PRINCE2, the ISO21500 standard uses phases and has categorized the 39 processes within the subject groups and process groups, as shown i tabel xx.
Initiating This is where the project gets initiated and it is within this phase the project gets defined and where the project manager establish the goal for the progress of the project.
Planning This process category is applied for preparing details for the project. In this process it is important to get enough details for the project manager to prepare goals and continue the project work.
Implementing In this process the project activities gets executed and the deliverance of the final product needs to match the project plan.
Controlling the controlling process are integrated among all the categories in the ISO21500 standard. Controlling are one of the most important processes of the ISO21500 and the goal of this process are to control the progress of the project and prevent problems along the way.
Closing The closing process are used to implement the completed project and collect new knowledge for future project.
Comparing these with the PMI and PRINCE2 standard many phases/processes recur.
Best practices based on network mapping
As the above has shown general principles among project management standards are a lot alike. But how does project managers in real life practices uses project management processes and subject to address projects. A pair of bachelor student from DTU has the past years analysed and gathered data, from a workshops held by professors of DTU for a collection of different project managers from different businesses in Denmark. The professors started out defining four main groups.
Vision
Complexity
Uncertainty
People
The participant of the workshop should now in groups discuss which concepts they uses in their project management practices and one by one place their concepts according to what main group they think fits the best for the concept.
Now all the participant write down all the tools they uses in their project management practices and add the tools to each concepts, depending on where the participants think the tool fits best. All data collected are then added to the network visualization tool gephi and analysed by the bachelor student of DTU. The approach to analyse the data collected, followed the method from (Thuesen, forthcoming, 2014)
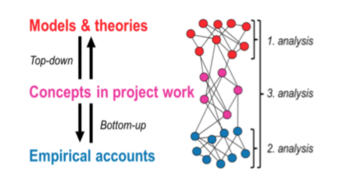
The analysis consist of 3 analysis.
1.Analysis (Models & theories):
The first analysis stems from a top down account of project management practice. This analysis consists of a understanding of general project management theories hereby PMI, PRINCE2 and ISO21500. The general understanding of these theories leads to textual analysis of in this case the ISO21500 standard. The textual analysis are then modeled in Gephi, which shows the standard as a network. The nodes and the edges between the nodes are chosen according to the significance of the concept written in the ISO21500 standard. From this analysis a network showing the connections between the subject and process of the ISO21500 standard. As it is shown in the graph xx some nodes has a higher degree than other. The graph indicate that eg communication and stakeholders har closely connected.
As Thuesen describe in his article “the ISO21500 has a broad view on project management which might have the potential for aligning different best practices standards”. This will be used for further analysis.
2. Analysis (Concepts in project work):
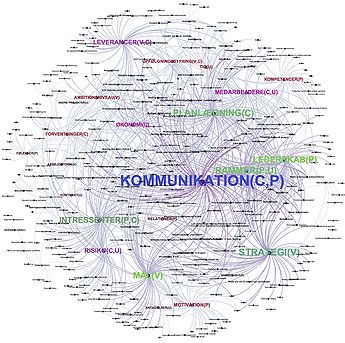
The second analysis uses the bottom-up accounts of practices which stems from the workshop held by DTU. As described earlier the participants brainstormed individually on their use of project management tools. These tools were then written down on a post it note and placed on the concept defined by a general discussion among the participants earlier in the process. All data are then collected and added to a spreadsheet where the analysis will begin. In the case of (Thuesen, forthcoming, 2014) the networks consist of 362 nodes and 599 edges.
Analysis of the network shows that some concepts are more central than others. Especially planning and communications has a significant size compared to other concepts in the graph. With respectly 111 nodes for Planning and 77 for communication.
3.Analysis (Empirical account)
The third analysis merges the top-down and the bottom-up approach and show some interesting knowledge about general project management and project management in theory.

