Quality Control
(→Correct, prevent & predict) |
(→Correct, prevent & predict) |
||
| Line 72: | Line 72: | ||
*The partners involved in construction project do not have a common goal, why is it hard to manage conformance for everyone. | *The partners involved in construction project do not have a common goal, why is it hard to manage conformance for everyone. | ||
| − | In following the three policies (corrective, preventive and predictive) | + | In following the three QC policies (corrective, preventive and predictive) will be clarified. |
==Corrective Quality Control== | ==Corrective Quality Control== | ||
Revision as of 10:28, 21 June 2017
Defects and errors in construction projects have been subject to attention in the medias and debates through out the years. A general consensus of a lack of quality on the construction sites exists, thus an increasing effort have been made to improve the quality of construction projects by a number of political initiatives[1]. When managing quality in a project an important aspect is Quality Control (QC), which is the topic of this article. First the definition of QC is elaborated and examples of process QC and product QC is given, in order to clarify the difference between the two types of QC. The standard DS/ISO 21500 outlines different aspects that have to be considered when performing QC, why these are mentioned in the article. Different QC policies and techniques exist and their objectives, advantage and disadvantages are elucidated. At last limiting conditions when performing QC are stated.
Contents |
Definition of Quality Control
Quality Control (QC) is a part of quality management of construction projects, and to be more exact QC is at the heart of conformance management. The aim of QC in construction projects is to assure high quality of the construction being built and the individual processes within the project. In this content “high quality” denotes fulfilling standards and the established quality requirements of the specific project [2]. It is important to investigate the causes of the arising problems, as well finding ways to eliminate unsatisfactory performance when performing QC, thus both corrective, preventive and predictive QC policies are essensial.
Product Quality Control vs. Process Quality Control
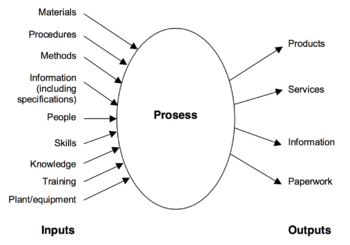
QC deals with the specific products as well as the processes as mentioned. A certain understanding of the process or product is needed in order to perform QC of either part. A process is the transformation of a set of inputs into the desired output. Figure 1 illustrates that the inputs can be materials, procedures and knowledge, etc. Each process in a construction project can be analyzed by itself and afterwards actions can be determined in order to improve the process, thus the process QC become preventive [3].
Examples of process QC can for example by:
- Measuring the temperature of the concrete during casting and check if it fulfills specifications.
- Controlling the QC process by checking if the QC methods agreed upon are carried out [4].
- Checking if the pile movements during the hammering process correspond to the predicted movements, when constructing the pile foundation.
QC of a product concerns the quality of the output/result of the process instead. It can be a product of a process in the design phase as well as in the construction phase. The output doesn't have be a physical product but can as well be a service, information or conducted paperwork as illustrated by Figure 1. Examples of defects that product QC deals with are:
- Missing informations in drawing material
- Moisture damage of a construction element
- Cracking in a welding
Performing Quality Control
| Primary inputs | Primary outputs |
|---|---|
|
Progress data Deliverables Quality plan |
Quality control measurements Verified deliverables Inspection reports Change requests Corretive actions |
In order to perform QC, tools and inspection procedures are needed. These inspection procedures and QC tools are specified in the part of the conformance management called Quality Assurance [2]. The primary inputs and outputs when performing QC in construction projects given by the standard DS/ISO 21500 [5] are shown in Table 1. Here it can be seen that QC has a high dependency of good planning, as the primary inputs are a result of planning the quality in the project. The primary outputs indicate, that checking if requirements are being meet is not satisfactory alone, but QC includes documentation, communication and analysis as well. Furthermore it is seen that QC also have to prevent defects and non-conformance from taking place.
The standard DS/ISO 21500 [5] states that QC should be performed during the whole project life cycle and that it includes following aspects:
- Monitoring the quality of the processes and detect defects.
- Analysing of the causes of defects and non-conforming performance.
- Eliminate unsatisfactory performance by identifying preventive actions and change requests.
- Communicating the changed requests and necessary corrective actions to project organization members.
Documentation is not mentioned directly by the standard, but it is implied in the last aspect "communication" as it is impossible to tell the craftsman, which corrective actions that have to be accomplished, without documentation. The documentation can be carried out with control tables, but in large construction projects digital quality documentation is preferred as many parts perform quality control. By using digital documentation like "digitjek”, ”C-web” og ”Ajour” position and date of the defect can be noted down on the layout drawing, so the craftsmen get a clear outline of the defects [6].
Correct, prevent & predict
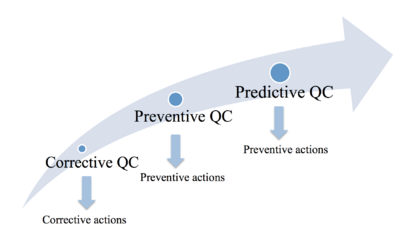
With the increased focus on minimizing non-conformance in construction projects the main goal of QC have shifted from a corrective to a predictive policy as illustrated on Figure 2. The intention of this shift is to predict the errors and defect, and thereby prevent them from happen. By achieving predictive and preventive QC the cost of the project will be decreased and time can be saved.
In the other industries this shift have already been seen, while different issues puts limits to the shift in the construction industry. Graham M. Winch mention four issues that slow down the development[2]:
- Construction projects are often unique, and this limits the value of experience and knowledge gained, as the project does not last long enough to achieve zero defects
- It is hard to implement statistical approaches to improve the processes, as the processes in the project only are repeated a limited number of times
- There are no rewards for the designer to make error free drawings, as this mostly benefits the contractor. So why should the designer invest time and money in QC of their drawings?
- The partners involved in construction project do not have a common goal, why is it hard to manage conformance for everyone.
In following the three QC policies (corrective, preventive and predictive) will be clarified.
Corrective Quality Control
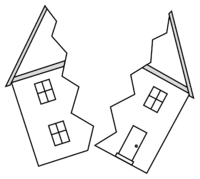
Corrective QC is necessary when non-conformance or a defect is found or a fatal event has occurred, thus corrective QC is defined as a reactive approach. This approach of QC is necessary because unexpected events and defect always will occur in construction projects. The ideal project where all problems are prevented is hard to establish, since many people, partners and processes are involved in the project. Questions like “have we met the requirements?” and “what went wrong?” are asked here.
This type of quality control can be expensive, due to the fact that rework can be very comprehensive [1]. Correcting serious errors can also be time consuming depending on how many parts that have to be involved in the rework, likewise new material deliveries can result in delays.
In order to correct errors, knowledge of the causes to the problem has to be obtained. Performing corrective QC can be accomplished with different techniques, and one technique is “cause and effects diagrams”, which is elaborated in following.
Preventive Quality Control
By changing the strategy of QC from corrective to preventive the questions to be asked now are "can we do the job correctly" and "are we doing the job correctly" [9]. A certain amount of knowledge and experience is required in order to answer the questions, else it is not possible to prevent failures and non-conformance from happening. It is a common problem, that the people trying to control procedures do not have the necessary competencies to do it. For this reason W. Edwards Deming, a guru of quality management, came with the advice [3]:
A way to increase preventive QC in construction projects is to make specifications, recommendations and regulations of work procedures, thus the people involved in the project can get a clear overview of which aspects of the procedure to focus on in order to prevent non-conformance.
Continous, delivery and start-up control
A qualitative analysis of processes and methods in flawless construction projects, which is based on experience from project managers, showed that continous QC, delivery QC and start-up QC was very import in order to prevent fatal errors [6]:
A way to prevent expensive corrective actions is to perform continuous QC. This can for example include thermo graphic measurements of the first rooms finished, and if non-conforming performance is found, then preventive actions can be made to assure the quality of the remaining rooms.
QC at delivery of materials e.g. reinforcement and concrete elements is essential, as these elements often are hidden, thus later control is impossible. Poor quality of these elements could be fatal as it can result in construction failure, which can be prevented by performing QC at the delivery.
Start-up QC at the shift between contractors can prevent errors from occurring. This way the quality of the previous work is assured and the following work is not going to hide defects that potentially can result in critical errors, that will be very expensive and time consuming to correct. This concept is also called "stop the line" in lean construction, where the following work are set on hold until all errors from previous work are corrected [10].
Predictive Quality Control

Predictions of possible failures is necessary, in order to determine preventive actions. Graham M. Winch states[2]:
This means predictions should be based upon analysis of data and well-founded arguments thus unnecessary actions aren't initiated. Valuable predictions can be made by modern technology, that makes it possible to collect large amounts of data from different systems. Problems can then be detected before they happen by analyzing the collected data. The choice of the digital tool is very important, as a wrong choice of a system can lead to a failed outcome of collected data, which limits the performance of predictive QC. [12]. Using this approach it is important that the problem leave digital footprints before it occurs, otherwise predictions can't be made.
Monitoring
Not written but is going to include:
Digital tools for inspections
Sensor systems
Radio Frequency Identification (RFID)
Quality control techniques
Various techniques and tools to perform QC are developed through time. Frequently used tools are Ishikawa's seven tools [13]:
1. Cause-and-effect diagram
2. Check sheet
3. Control chart
4. Histogram
5. Pareto chart
6. Scatter diagram
7. Flow charts
In the following two of the tools (Cause-and-effect diagrams and Flow charts) will be described in relation to QC in construction projects.
Cause-and-effect diagrams
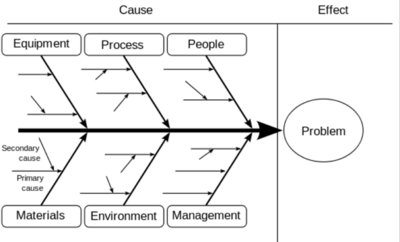
Cause-and-effect diagrams also go under the names “fishbone diagram” (due to the shape) and “Ishikawa diagram” (after the inventor of the technique). The reason for the name “cause and effect diagram” is that the diagram is separates the problem (the effect of the causes) from the causes. The basic idea of the technique is to work back from the problem by asking: “why did it occur”, and in that way finding the different roots to the problem [2]. Each cause is thereby found by using a form of brainstorm technique, and they are grouped under different categories. A cause can either be a primary cause or a secondary cause to the primary cause. When illustrating the causes this way, the diagram takes form as a fish skeleton as shown from Figure 6.
A cause-and-effect diagram shows there often are several roots to non-conformance and defects, and that several corrective/preventive actions have to be performed. This allegation becomes clear by grouping the causes under different categories, because it illustrates the difficulties of complex processes. The categories often include people, process/methods, equipment/machines, material, environment and management, as these are some of the basic elements in construction projects [14].
Value stream mapping (Flow charts)
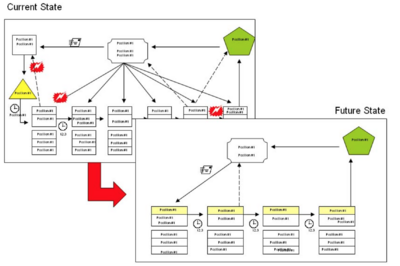
Value stream mapping (VSM) is a preventive QC technique, that focus on understanding the details of all the discrete elements in a process [2], thus the current value stream of the process can be visualized and in this way sources that produces non-conformance are discovered and eliminated. It helps individuals to understand the process instead of focusing on the result of the process, which is the reason for increase of efficiency by using this technique. Value-stream mapping makes it possible to identify effective testing equipment, testing strategies and quality control loops [16]. Figure 8 is an illustration of the overall structure of a value stream map. Here is it seen that is a flow chart, that identify the flow of materials, information, etc.
The technique requires following steps to be carried out:
1. Map the process at current state.
2. Rate the value of each step of the process, and identify and discuss opportunities of improvement.
3. Remap the process for the ideal future state.
At the first step it is very important to gather all the persons involved in the process, in order to get a correct picture of the current state and prevent assumptions about the process. Sometimes it can be an advantage to observe the process and collect actual data of the process. When identifying the ways of improvement, it is very important to have the outcome in mind to improve the quality [16]. VSM is only relevant when processes that are repeated, which are fairly limited in construction projects compared to other industries. However the number of repeated processes are increasing due to standardisation and pre-assemply are more common [2].
Limitations
Not written but is going to include:
The requirements have to be clear (from the client to the designer, as well as to the entrepreneurs and craftsmen)
Operationally orientated and doesn't take factors as customer satisfaction into account
Project specific control
Not enough resources from the designers
Time – there have to be time to do it.
Knowledge – people have to understand the process in order to control them. Problem is that managers are trying to control processes they have no knowledge about. (Cite Oakland den mindre article)
Designer makes errors ... (processes that can't be done etc.)
Limitations for shift from corrective to predictive (winch)
Annotated bibliography
Is going to include:
Karins store report
Article: Quality Value stream mapping
Article: Active construction QC
Article: Automated project performance QC of construction projects
References
- ↑ 1.0 1.1 Schultz, Casper S., Jørgensen, Kirsten, Bonke, Sten and Rasmussen, Grane M. G., Architectural Engineering and Design Management, Taylor and Francis Group, 2015, " Building defects in Danish construction: project characteristics influencing the occurrence of defects at handover"
- ↑ 2.0 2.1 2.2 2.3 2.4 2.5 2.6 Winch, Graham M., Wiley-Blackwell, 2010, "Managing Construction Projects, 2nd edition "
- ↑ 3.0 3.1 Oakland, John S., Rutledge Taylor and Francis Group, 2008, "Statistical Process Control", Sixth edition
- ↑ IRMI, "Construction Quality Management", access: 12-06-2017,https://www.irmi.com/articles/expert-commentary/construction-quality-management]
- ↑ 5.0 5.1 5.2 Danish Standards, 2013, "DS/EN 21500: Guidance on project management, 2nd edition
- ↑ 6.0 6.1 Jørgensen, Kirsten; Schultz, Casper S.; Bonke, Sten, Technical University of Denmark, 2013, "Processer og metoder i det fejlfrie byggeri: Erfaringer og anbefalinger fra projektledere i entreprenørbranchen"
- ↑ The church of Jesus Christ of latter-day saints, "Helaman 1–6", access: 12-06-2017,https://www.lds.org/manual/book-of-mormon-teacher-resource-manual/helaman-1-6?lang=eng]
- ↑ T&W Church solutions, "The Top 7 Mistakes Made by Church Building Committees and How to Prevent Them!!!", access: 12-06-2017, http://www.tw-church.com/The-Top-7-Mistakes-Made-by-Chur.html]
- ↑ Oakland, John S., Quality and Reliability Engineering International, volume 9, issue 6, 1993, "Total quality management"
- ↑ Simonsen, Rolf, Værdiskabende Byggeproces, 2017, "Lean Construction & Last Planner System
- ↑ Skipprichard Leadership insights, "The Surprising Predictive Power of Analytics", access: 12-06-2017, https://www.skipprichard.com/the-surprising-predictive-power-of-analytics/]
- ↑ Cyient, 2016, "Engineering solutions for predictive maintenance in rail"]
- ↑ Ishikawa, Kauro, Tokyo 3A Corporation, 1990, "Introduction to Quality Control "
- ↑ 14.0 14.1 Wikipedia, "Ishikawa diagram ", access: 11-06-2017, https://en.wikipedia.org/wiki/Ishikawa_diagram]
- ↑ Lean homebuilding, "Value stream mapping ", access: 13-06-2017, https://leanhomebuilding.wordpress.com/2010/04/14/value-stream-maps-visualizing-waste/]
- ↑ 16.0 16.1 Haefnera, Benjamin; Kraemera, Alexandra; Staussa, Torsten; Lanzaa, Gisela, Variety Management in Manufacturing. Proceedings of the 47th CIRP Conference on Manufacturing Systems, 2014, "Quality Value Stream Mapping "
