Work Breakdown Structure (WBS) in Project Management
Thanosfotis (Talk | contribs) |
Thanosfotis (Talk | contribs) |
||
| Line 59: | Line 59: | ||
The last of the three well known tree views is the centralized tree structure, where the root of the tree is at the center of the WBS diagram and the decomposition elements are moving towards the diagram’s edges. A typical centralized WBS example is illustrated in the figure 3. This type of tree representation can be quite powerful during the WBS development phase. | The last of the three well known tree views is the centralized tree structure, where the root of the tree is at the center of the WBS diagram and the decomposition elements are moving towards the diagram’s edges. A typical centralized WBS example is illustrated in the figure 3. This type of tree representation can be quite powerful during the WBS development phase. | ||
| − | Except for the aforementioned graphical representation of WBS, there are also outline and tabular representation ways that they are likely to communicate more accurately and efficiently the WBS elements to the relevant stakeholders. Figures 4, 5 and 6 present typical examples of tabular WBS views. The main content of the following figures is common, but each one serves different purpose according to the stakeholders that receive and reflect on the information. | + | Except for the aforementioned graphical representation of WBS, there are also outline and tabular representation ways that they are likely to communicate more accurately and efficiently the WBS elements to the relevant stakeholders. Figures 4, 5 and 6 present typical examples of tabular WBS views. The main content of the following figures is common, but each one serves different purpose according to the stakeholders that receive and reflect on the information. |
| + | |||
| + | |||
| + | [[File:Fotis5.png|1300px|thumb|center|Figure 5: Outline WBS View, <ref name="foundation"/>]] | ||
| + | |||
| + | [[File:Fotis6.png|1300px|thumb|center|Figure 6: Tabular View, <ref name="foundation"/>]] | ||
==References== | ==References== | ||
Revision as of 00:16, 19 May 2019
Contents |
History
The Work Break Down Structure (WBS) was developed during 1960s by the U.S. Department of Defense (DoD) and the National Aeronautics and Space Administration (NASA) under the two main pillars of ‘’planning’’ and ‘’controlling’’ the large projects they were responsible for, in order to provide the best quality. Specifically, on June 1962, NASA and DoD published a document regarding PERT/COST which was the first approach to the Work Breakdown Structure. It is worth pointing out, that this guide was adopted in all services as a military standard across DoD [1].
In 1987, this approach of WBS was documented from the Project Management Institute (PMI) in order to provide a generic concept of these techniques for non-defense organizations. Ergo, the Project Management Body of Knowledge (PMBOK) Guide provides an overview of WBS approach for general application through the organizations.
Definition of Work Breakdown Structure
The Work Breakdown Structure (WBS) is a widely applied tool in the field of project management which is defined as the hierarchical decomposition framework for presenting the work that needs to be executed by the team, in order to achieve the project objectives. (ISO 21500 Standard, p. 18). Specifically, it creates the backbone of the project and provides a clear visual overview of the work to be completed. WBS is a tool that gives the ability to the project team to develop the project schedule and the resource requirements, to estimate and control the cost, while at the same time to minimize the number of unexpected situations. Therefore, the main purpose of WBS is to organize the team’s work into manageable sections and define the total scope of the project.
The 100% Rule
The 100% Rule is one of the most vital principles of WBS, which has been established from the Project Management Institute (PMI), in order to achieve a highly effective WBS and evaluate its decomposition. This rule is defined as: “The next decomposition of a WBS element (“child” level) must represent 100 percent of the work applicable to the next higher (“parent”) element [2].
According to the PMBOK, the total of the work is distributed from the lowest to the higher levels, in order to ensure that nothing is left out and prevent any extra work to be performed. It is also worth pointing out that the 100% rule is not only applied in the work packages of the project, but also in the activity level. More specifically the activities which are represented in each work package should sum up to 100% [3]. However, the use of the 100% Rule should be followed with the clear distinction between the elements of the WBS, since it can cause inadequate communication between the project team, double work and confusion from a financial point of view. Hence, it is suggested to use WBS dictionary to avoid this kind of ambiguities in order to eliminate risks regarding the final project outcome [3].
The 100% Rule Example
The 100% Rule provides the project manager with all the necessary information regarding the specific tasks should be performed in each area in order to complete the project and the responsible people for each task. In that way the project manager is aware of the project’s progress and ensures that everything is aligned and everything is related in the WBS elements. The WBS consists one of the first steps of the planning process, since it allows that all outcomes are specified before the schedule planning. Another critical aspect of the 100% Rule, is that assists the project manager to ensure that project costs are aligned with the work and every activity is related with the project in order to be completed and finally achieve the desired outcome.
In the following figure is clearly illustrated how the 100% rule can be applied in the WBS of a project. Specifically, the project consists of a deliverable which is defined in the top level of the WBS regarding the construction of a house. In the second level The 100% rule is clearly illustrated in the following figure which represents the WBS of a project according with the 100% rule’s principles. The project has a deliverable which is defined in the top level of the WBS and The main deliverable which consists the level 1 of the WBS is the construction of the house.
WBS Decomposition
The decomposition process of the WBS aims to capture the entire project scope by providing the necessary level of details in all the involved stakeholders of the project, in order to achieve the highest level of communication, management and control. The level of details in the WBS is not specific, but varies from project to project and depends on the project’s complexity, the experience of the project team and the need for control. For instance, if the project manager and the project team are experienced and familiar with the tasks to be executed from their involvement in previous projects, the level of detail can remain at a higher level. However, if the project manager or the project team are not experienced, the need for preparation of a very detailed WBS seems essential in order to provide all the necessary information regarding the tasks everyone should accomplish. In that way, the project manager eliminates the risks, ensuring that the project scope is clear in every level.
It is worth pointing out that the full decomposition process does not take place always in the initiation of the project. Especially in large and complex projects, the decomposition of the WBS is partial until further information regarding the processes are known. In some other projects is decided from the project team that only some parts of the WBS can be fully decomposed from the initiation, while other parts can be enriched during the project. This technique is known as the “rolling wave” and demonstrates the flexibility of the WBS’ creation according to the project needs [4].
Another critical point of the WBS decomposition that also varies from project to project is the logic it is based on. The most typical schemes of WBS decomposition are structured according the following [4]:
- Function
In this form of decomposition, the project deliverables are divided into groups according their business function. This style of decomposition aims to enhance the coordination and communication of responsibility to all the involved stakeholders.
- Role
The purpose of a role-based decomposition is similar to the latter one, while it is structured in that way in order to promote the communication of responsibility for the deliverables.
- Method
This type of decomposition is structured on predefined methodologies and in contradiction to the aforementioned, the main purpose is to communicate the project’s outcomes at every level of the WBS among the stakeholders.
- Deliverables
The project deliverables are subdivided into smaller and more manageable components. This form of breakdown is the most common while it is not depended on the organization structure or project type.
In conclusion, the selection of the decomposition logic is critical and should be aligned with the desired outcomes the project manager and project team want to achieve, as well as with the project organisation’s standards.
WBS Representation
The purpose of the WBS is to communicate the scope of the project to all the relevant project stakeholders. As diverse stakeholders have different needs, different WBS representation methods are required. The most widely used representation views are outline, tabular and tree structure.


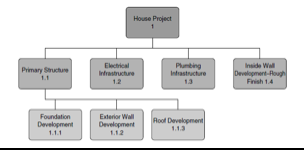
The tree structure uses alternative representation types with the organization chart technique being the most common one. As it is presented in the figure 2, in this view the root of the tree is on top and the WBS decomposition is performed vertically to the diagram’s bottom.
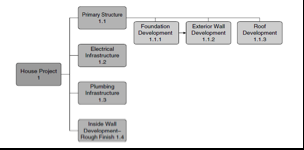
The tree view representation can be easily modified into other views. The horizontal WBS has the root of tree on the left, whereas the WBS is decomposed horizontally towards the right side of the diagram and it is depicted in the figure 3.
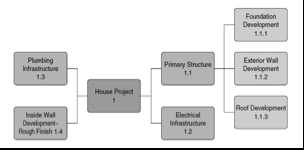
The last of the three well known tree views is the centralized tree structure, where the root of the tree is at the center of the WBS diagram and the decomposition elements are moving towards the diagram’s edges. A typical centralized WBS example is illustrated in the figure 3. This type of tree representation can be quite powerful during the WBS development phase.
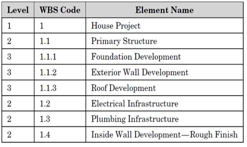
Except for the aforementioned graphical representation of WBS, there are also outline and tabular representation ways that they are likely to communicate more accurately and efficiently the WBS elements to the relevant stakeholders. Figures 4, 5 and 6 present typical examples of tabular WBS views. The main content of the following figures is common, but each one serves different purpose according to the stakeholders that receive and reflect on the information.


References
- ↑ DOD and NASA Guide, PERT/COST System Design, June 1962
- ↑ Gregory T. Haugan “Effective Work Breakdown Structures”, 2002, Vienna, VA Management Concept, p.17
- ↑ 3.0 3.1 https://project-management.com/wbs-types-work-breakdown-structure/#100-percent-rule
- ↑ 4.0 4.1 Project Management Institute. “A Guide to the Project Management Body of Knowledge(PMBOK® Guide)”- Fifth Edition, 2013
- ↑ 5.0 5.1 5.2 5.3 5.4 Eric S. Norman, Shelly A. Brotherton, Robert T. Fried. “Work Breakdown Structures: The Foundation for Project Management Excellence”- John Wiley & Sons, 2008
