DS Solution
(→A3 REPORT) |
(→A3 REPORT) |
||
| Line 101: | Line 101: | ||
==A3 REPORT== | ==A3 REPORT== | ||
| − | '''The A3''' process is a Lean thinking tool, which helps teams to have a continuous improvement through problem solving, reporting project status and proposing policy changes. In the same way, this tool is a method to cooperate in a strategically way to reach the purpose and goals of the team or organization. In this way, the A3 tool is going to help the team/organization ensuring standardization (process is used consistently through every member), collaboration (bridge the gaps between teams), visibility (for improvement), impact (determine the quantitative and qualitative results) and knowledge transfer (available to all employees at any time). | + | '''The A3''' <ref name=''name''> ''The - https://www.google.com'' </ref> process is a Lean thinking tool, which helps teams to have a continuous improvement through problem solving, reporting project status and proposing policy changes. In the same way, this tool is a method to cooperate in a strategically way to reach the purpose and goals of the team or organization. In this way, the A3 tool is going to help the team/organization ensuring standardization (process is used consistently through every member), collaboration (bridge the gaps between teams), visibility (for improvement), impact (determine the quantitative and qualitative results) and knowledge transfer (available to all employees at any time). |
It is possible to recognize in the A3 process two big parts: Identify the problem and Implement the solution, where each part has different steps. | It is possible to recognize in the A3 process two big parts: Identify the problem and Implement the solution, where each part has different steps. | ||
Revision as of 11:30, 8 March 2020
Contents |
Introduction
Tools
SWOT Analysis
Defenition
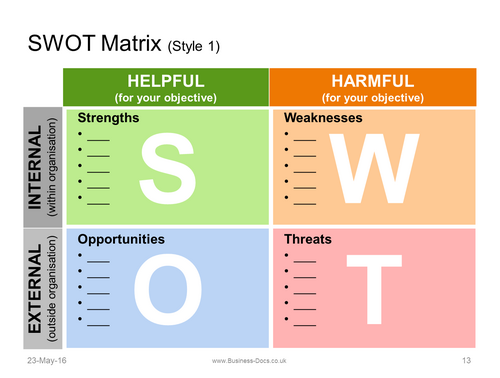
SWOT Analysis [1] is a planning exercise in which managers identify internal organizational strengths (S) and weaknesses (W) and external environmental opportunities (O) and threats (T), using the popular 2x2 matrix.
Practical guidelines
The first step in SWOT analysis is to identify an organization’s strengths (such as high-quality skills in marketing and in research and development) and weaknesses (such as rising manufacturing costs and outdated technology). The task facing managers is to identify the strengths and weaknesses that characterize the present state of their organization.
The second step in SWOT analysis begins when managers embark on a full-scale SWOT planning exercise to identify potential opportunities and threats in the environment that affect the organization now or may affect it in the future. After applying a SWOT analysis on a business project, decision-makers should understand if the goal is attainable or not. In case that the goal is not achievable, decision-makers must select another goal and repeat all the process again.
ADKAR
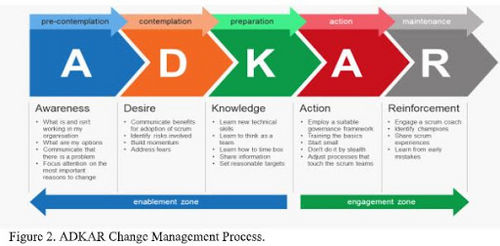
The ADKAR model [2] is a 5-step framework that helps deal with the people-aspect of change management. ADKAR is an acronym that represents the five milestones or outcomes an individual must achieve for change to be successfully realized: awareness (of the need to change), desire (to participate and support the change), knowledge (about how to change), ability (to implement new skills and behaviors) and reinforcement (to keep the change in place).
When applied to organizational change, this model allows leaders and change management teams to focus their activities on what will collectively drive individual change and produce organizational results. The ADKAR Model will highlight the areas where you can take focused, corrective action to improve change success.
HOUSE OF QUALITY
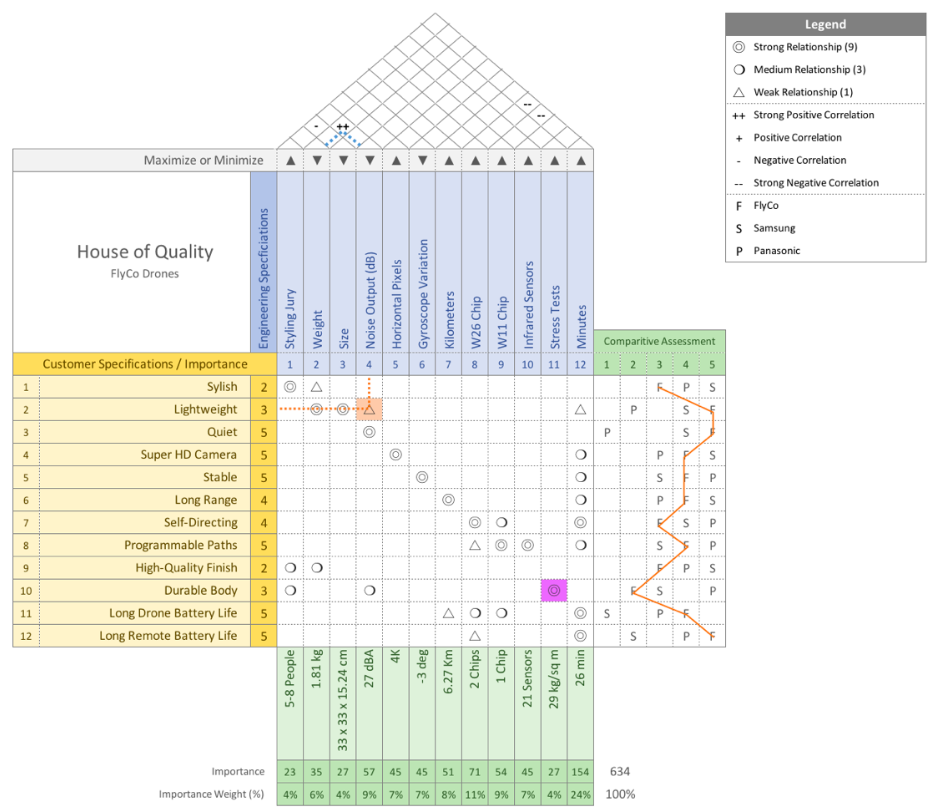
The Quality Functional Deploymentwrite [3]is a complex process divided into three steps, with the aim of find out the specific costumer’s requests. Their preferences, collected in the first and second step, are reported in a diagram, called the House of Quality. It’s built in ten different moments:
- List of costumers’ needs
- Index of importance according to costumers’ needs
- Translation od costumers’ needs into technical specifications
- Units of measurement of technical specifications
- Correlation matrix
- Relation matrix
- Relative importance of technical specifications
- Comparison with competitor’s products
- Technical benchmark
- Analysis of organizational difficulties
This modular tool ensure full coherence between the design of the product and its production, reducing the corrections during the development of the project.
The requests without a formal response in quantified attributes appear as an empty column or an empty line in the diagram.
DECISION TREE ANALASYS
Defenition
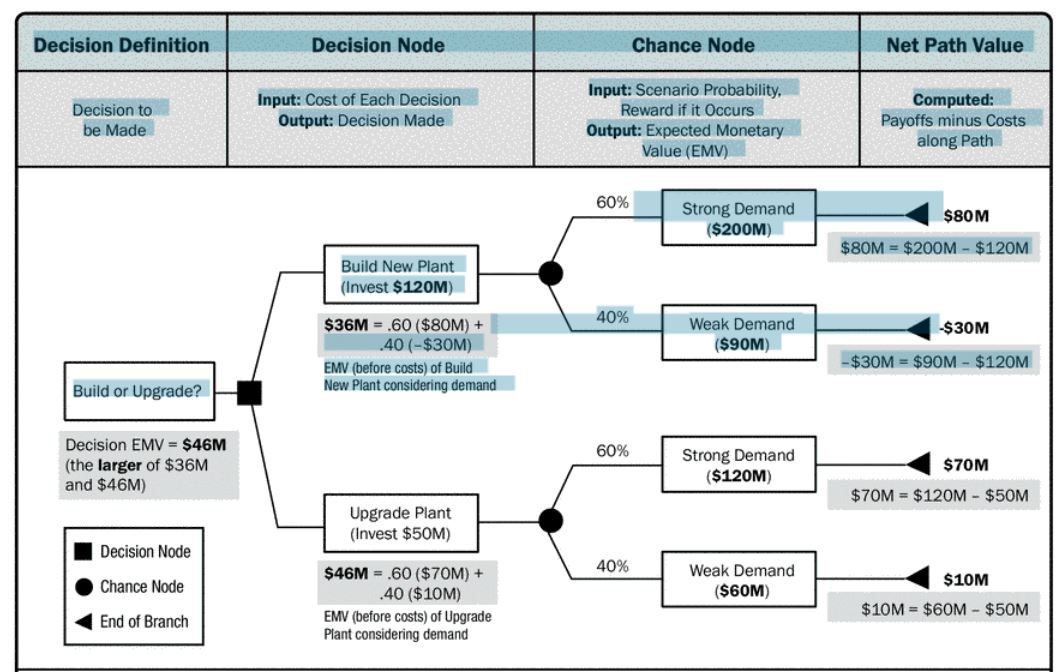
Decision trees[4] are used to support selection of the best of several alternative courses of action. Alternative paths through the project are shown in the decision tree using branches representing different decisions or events, each of which can have associated costs and related individual project risks (including both threats and opportunities). The end-points of branches in the decision tree represent the outcome from following that particular path, which can be negative or positive.
practical guidelines
Decision trees are commonly used in operations research and operations management. If, in practice, decisions have to be taken online with no recall under incomplete knowledge, a decision tree should be paralleled by a probability model as a best choice model or online selection model algorithm. Another use of decision trees is as a descriptive means for calculating conditional probabilities.
S.M.A.R.T
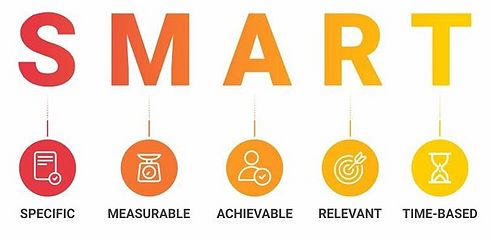
The S:M:A:R:T[5] is used to achieve goals, they must be formulated so that each employee understands them correctly. There should be no room for misinterpretation. Because of that goals must be formulated “smart”. The term is an abbreviation of the American, and the letters "S.M.A.R.T." stand for: "specific, measurable, achievable, relevant and time-based".
Specific (simple, sensible, significant).
- What do I want to accomplish?
- Why is this goal important?
- Who is involved?
- Where is it located?
- Which resources or limits are involved?
Measurable (meaningful, motivating).
- How much?
- How many?
- How will I know when it is accomplished?
Achievable (agreed, attainable).
- How can I accomplish this goal?
- How realistic is the goal, based on other constraints, such as financial factors?
Relevant (reasonable, realistic and resourced, results-based).
- Does this seem worthwhile?
- Is this the right time?
- Does this match our other efforts/needs?
- Am I the right person to reach this goal?
- Is it applicable in the current socio-economic environment?
Time-based (time-based, time limited, time/cost limited, timely, time-sensitive).
- When?
- What can I do six months from now?
- What can I do six weeks from now?
- What can I do today?
With the help of this tool it is possible for us to formulate goals properly, to share them in an understanding manner and to monitor the progress quickly.
A3 REPORT
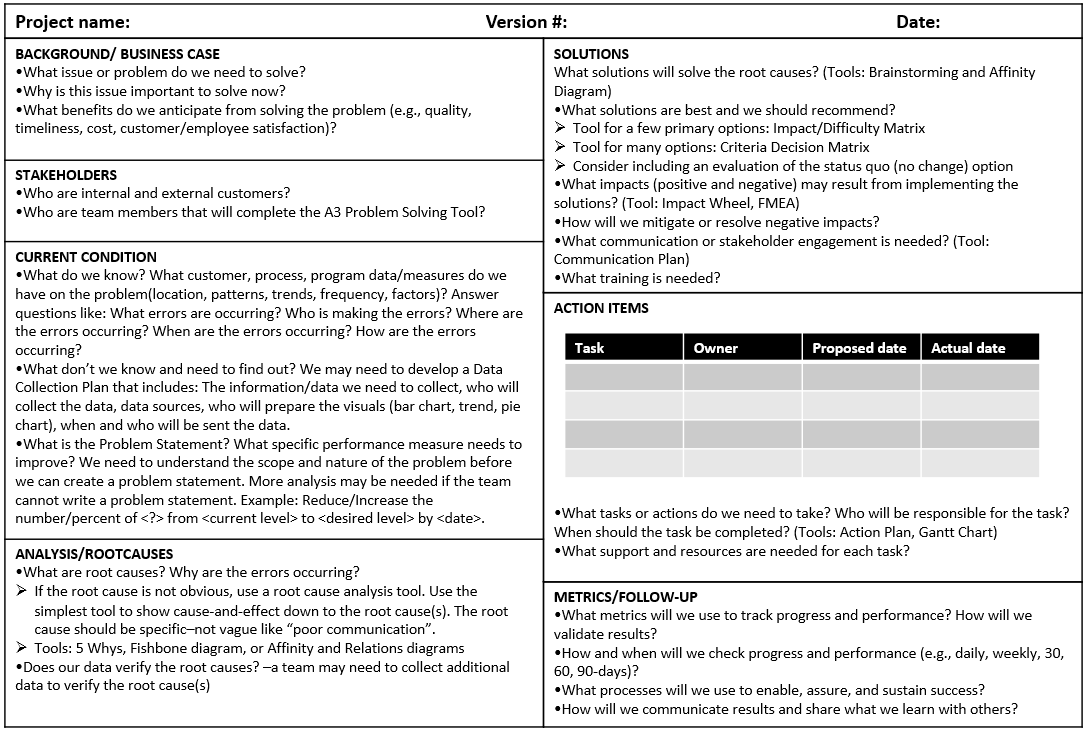
The A3 [6] process is a Lean thinking tool, which helps teams to have a continuous improvement through problem solving, reporting project status and proposing policy changes. In the same way, this tool is a method to cooperate in a strategically way to reach the purpose and goals of the team or organization. In this way, the A3 tool is going to help the team/organization ensuring standardization (process is used consistently through every member), collaboration (bridge the gaps between teams), visibility (for improvement), impact (determine the quantitative and qualitative results) and knowledge transfer (available to all employees at any time). It is possible to recognize in the A3 process two big parts: Identify the problem and Implement the solution, where each part has different steps.
To identify the problem is necessary to find out:
- The issue that is needed to solve.
- Stakeholders.
- Current situation.
- Root cause analysis.
On the other hand, to implement a solution is necessary to find out:
- What solutions solve the root causes and which are their impacts.
- Develop a plan of implementation with every member on board.
- Finally follow-up and evaluate results.
WBS
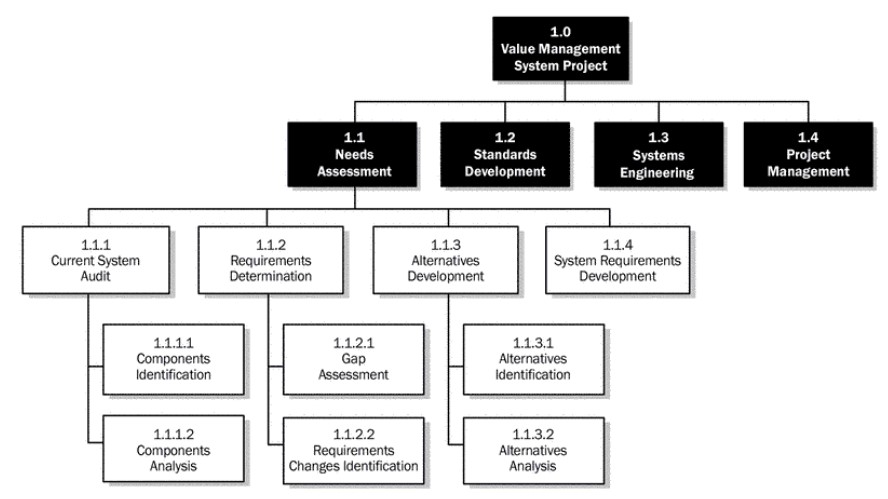
The WBS (Work Breakdown Structure) [7] is a hierarchical decomposition of the total scope of work to be carried out by the project team to accomplish the project objectives and create the required deliverables. Each descending level of the WBS represents an increasingly detailed definition of the project work. The lowest level of the WBS is formed by the work packages with a unique identifier, which can be used to group the activities where work is schedule and estimated, monitored, and controlled.
Create WBS
Decomposition is a technique used for dividing and subdividing the project scope and project deliverables into smaller, more manageable parts. The level of decomposition is related to the degree of control needed to effectively manage the project. The level of detail for work packages depends on the size and complexity of the project. A WBS structure may be created through various approaches. Some of the popular methods include the top-down approach, the use of organization-specific guidelines, and the use of WBS templates. A bottom-up approach can be used to group subcomponent.
THE IRON TRIANGLE
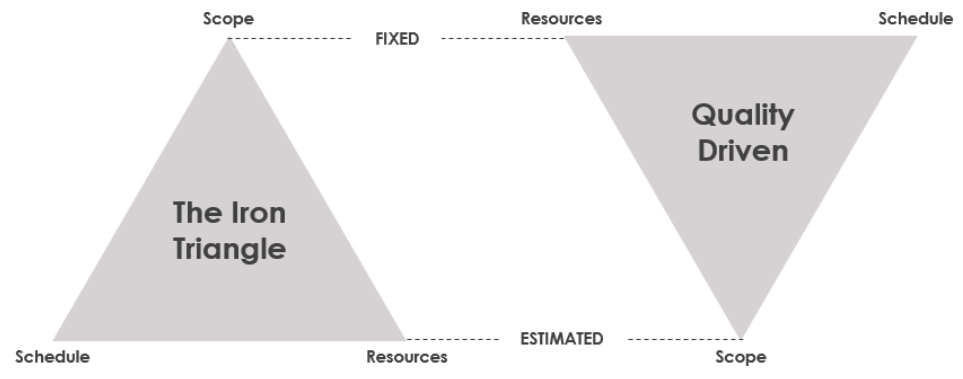
The Project Management Triangle is a tool that gives a model of the restrictions of project management. Is very important for the success of a project to handle the different situations, in a way to maintain stability with the different factors that constrain the overall project delivery. These factors are: Scope, Schedule and Cost. Scope allude of all the actions, performances and works involved in the project, Schedule is the estimated time for the project delivery and Cost are all the resources necessaries to deliver the work. In this way, the manner of dealing and controlling these three factors with their constraints is going to determine the quality of the work, and if one of these constraints changes, then is going to be necessary to change another one to keep the same initial quality.
Now, if we compare the Traditional triangle with the agile one, there are some few differences. In the traditional one, there is a fixed scope of product requirements, which implies that is necessary to be a little flexible with the resources and schedule. In the other hand, the Agile triangle has a fixed schedule and resources, which means that the scope needs to be a little flexible.
In the next figure you can see the Traditional triangle on the left and the Agile triangle on the right:
STAR MODEL
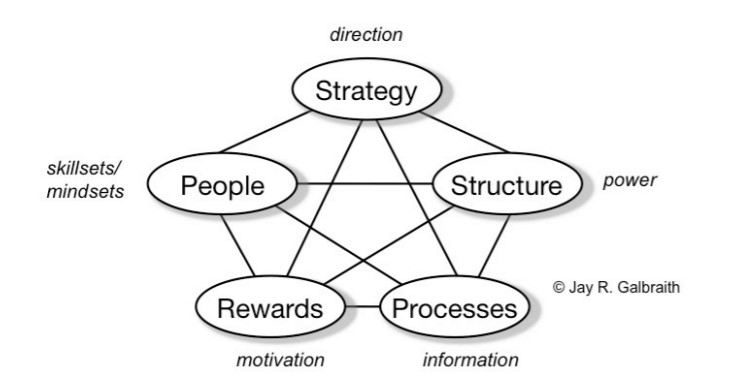
The Star Model[8]framework for organization design is the foundation on which a company bases its design choices. The framework consists of a series of design policies that are controllable by management and can influence employee behavior. The Star Model has 5 categories:
- Strategy, it specifies the goals and objectives to be achieved by the company;
- Structure, it determines how the power is distributed;
- Processes, it represents how the information and decisions flow into the organization;
- Rewards, its purpose is to align the organization's goals with the employee's goals;
- People, it produces the talent required by the strategy and structure of the organization;
Implication
Although the structure is usually overemphasized because many people believe that it affects status and power, the Structure in the Star Model is only one facet. Another important feature in the Star Model is that different strategies lead to different organizations. This means that there is no one-size-fits-all organization design. The third implication is that for an organization to be effective, all the policies must be aligned and interacting harmoniously with one another.
STAKEHOLDER ANALASYS
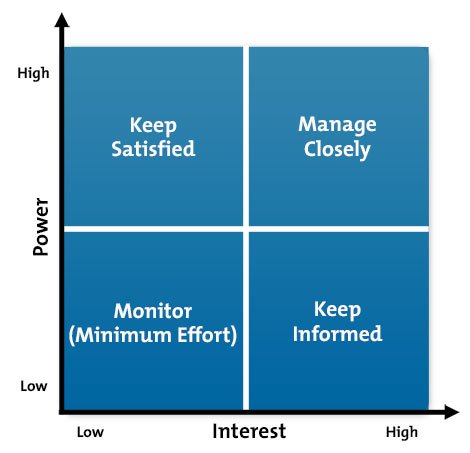
The aim of the stakeholder analysis (also environment analysis or force field analysis) is to recognize which internal and external people could influence the project and to work on it. In addition, these people and groups are categorized and evaluated with regard to their values and influences as well as ideas. [9] Stakeholder analysis typically involves the following four steps.
- Identifying: Listing the individuals or groups that can be affected by and/or affect the change program.
- Analyzing: Formulating an understanding of the stakeholders, regarding their point of view, ambitions, power etc.
- Mapping: Visualizing the results of the previous step.
4. Prioritizing: Ranking the relevance/importance of stakeholders in order to decide with which to engage.
Based on the results of the stakeholder analysis, we as a project team know how and why the respective stakeholders act the way they do and what we can do about possibly negative stakeholders to make them positive.
[11]
INTERVIEWS
Defenition
An interview is a formal or informal approach to elicit information from stakeholders by talking to them directly. It is typically performed by asking prepared and spontaneous questions and recording the responses. Interviews are often conducted on an individual basis between an interviewer and an interviewee, but may involve multiple interviewers and/or multiple interviewees.
Benefits
Interviewing experienced project participants, sponsors, other executives, and subject matter experts can aid in identifying and defining the features and functions of the desired product deliverables. Interviews are also useful for obtaining confidential information, assumption and constraint analysis.
BRIGHTLINE TRANSFORMATION COMPASS
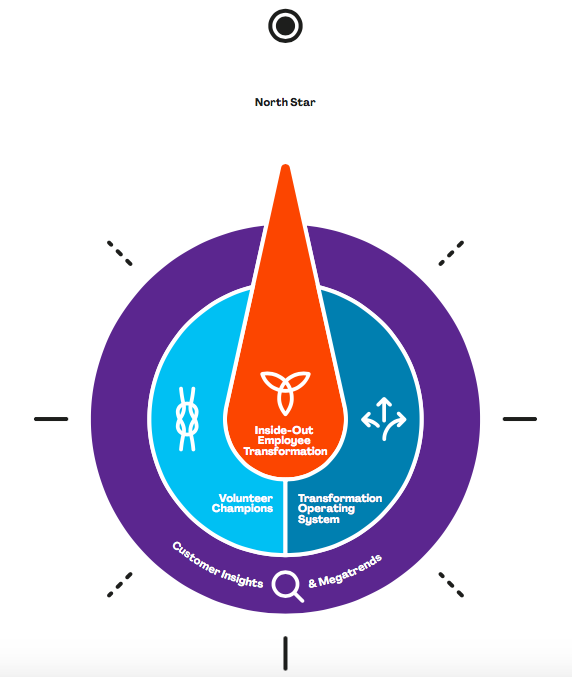
The Brightline Transformation Compass [12] is a successful method to implement in a company, in order to transform the mind-set of the employees and thus the culture of the organization. The concept of a compass, on which this theory is based, consists of five main blocks of transformation:
- The North Star: motivate the employees through a strategic vision
- Costumer Insights & Megatrends: choose some needs as a target to start an intern and external analysis (studying deeply the ecosystem of competitors)
- Transformation Operating System: the structure of an organization must fit the pace and the targets of the effort.
- Your Volunteer Champions: all the employees who are willing to drive the strategy forward while continuing to deliver in their day to day jobs.
- Inside-out Employees Transformation: each employee must focus on his personal skills.
References
- ↑ Gareth R. Jones and Jennifer M. George, Essentials of Contemporary Management, Eighth Edition, page 198, McGraw-Hill Education, 2019, ISBN 9781259927652
- ↑ The Prosci ADKAR Model: Why it Works - https://www.prosci.com/resources/articles/why-the-adkar-model-works
- ↑ Gestione dei progetti di innovazione, Alessandro Grandi, Mcgraw Hill Education, 2017
- ↑ https://en.wikipedia.org/wiki/Decision_tree
- ↑ https://hr.wayne.edu/leads/phase1/smart-objectives https://www.mindtools.com/pages/article/smart-goals.htm https://www.motiviertproduktiv.de/smart-ziele-formulieren-beispiele/
- ↑ The - https://www.google.com
- ↑ Project Management Institute, Inc.. (2017). Guide to the Project Management Body of Knowledge (PMBOK® Guide) (6th Edition) - 5.4.1.4 Organizational Process Assets. (pp. 156-157). Project Management Institute, Inc. (PMI). Retrieved from https://app.knovel.com/hotlink/pdf/id:kt011DX6D4/guide-project-management/create-wbs-organizational
- ↑ https://www.jaygalbraith.com/images/pdfs/StarModel.pdf
- ↑ https://www.mindtools.com/pages/article/newPPM_07.htm
- ↑ https://www.mindtools.com/media/Diagrams/stakeholdergrid1new.jpg
- ↑ http://wiki.doing-projects.org/index.php/Stakeholder_Management_in_Change_Programs
- ↑ The Brightline Transformation Compass: a compensive system for transformation https://brightline-website.s3-us-east-2.amazonaws.com/downloads/compass/The_Brightline_Transformation_Compass.pdf?utm_source=website&utm_medium=skip-link
