Waste management on construction sites
(→The Iron Triangle) |
Janak Raja (Talk | contribs) (→Value Propositions Canvas) |
||
| Line 321: | Line 321: | ||
* Focusing only on functional jobs: Once the customer profile is completed then the customer job is labelled as functional, emotional or social in nature. But most commonly managers tend to label the job as functional but it is really important to think beyond and realize the social and emotional jobs that are actually pushing the customers. | * Focusing only on functional jobs: Once the customer profile is completed then the customer job is labelled as functional, emotional or social in nature. But most commonly managers tend to label the job as functional but it is really important to think beyond and realize the social and emotional jobs that are actually pushing the customers. | ||
* Trying to address every customer pain and gain: It is a common tendency to link every pain, gain and the job of the customer profile to the value map. But it is unrealistic to believe that the product can satisfy every aspect of the customer profile. Trying to achieve this a waste of time that can be used to do better things and as a result, people end up not performing well in any one of those things which will, in turn, leave the customer unsatisfied. <ref> Garner, Benson. (19.02.2015) 5 Common Mistakes to Avoid When Using the Value Proposition Canvas. (08/03/2020) https://www.strategyzer.com/blog/posts/2015/2/19/5-common-mistakes-to-avoid-when-using-the-value-proposition-canvas </ref> | * Trying to address every customer pain and gain: It is a common tendency to link every pain, gain and the job of the customer profile to the value map. But it is unrealistic to believe that the product can satisfy every aspect of the customer profile. Trying to achieve this a waste of time that can be used to do better things and as a result, people end up not performing well in any one of those things which will, in turn, leave the customer unsatisfied. <ref> Garner, Benson. (19.02.2015) 5 Common Mistakes to Avoid When Using the Value Proposition Canvas. (08/03/2020) https://www.strategyzer.com/blog/posts/2015/2/19/5-common-mistakes-to-avoid-when-using-the-value-proposition-canvas </ref> | ||
| − | The Value Proposition Canvas can be an effective tool to help us understand how sorting of wastes efficiently can provide value and save money to MT | + | The Value Proposition Canvas can be an effective tool to help us understand how sorting of wastes efficiently can provide value and save money to MT Højgaard. |
=Problem Tree = | =Problem Tree = | ||
Revision as of 09:49, 9 March 2020
Group: The Minions
Members: Signe Ebsen Olling (s154194), Janak Raja (s192757), Samarth Shivanand Karseri (s192743), Kathrine Butler (s153360) Amalie Hammershøy (s152985), Arsalan Aman (s190218)
Contents |
Introduction
The construction industry is responsible for approximately 30-40% of the total waste handled in Denmark, which corresponds to 40% of the CO2 emission [1]. A new Danish climate law states that the CO2 level within 2030 has to be reduced by 70% compared to the level in 1990. A number of larger companies in Denmark have made a business plan for reaching a more sustainable future, which includes reducing the level of CO2 emitted from the building industry. One company that focuses on looking into a more sustainable future is MT Højgaard, who wants to improve their sustainable process by, among other things, better waste management. Better waste management can influence more parameters for MT Højgaard: sustainability on the site and economics for MT Højgaard. By ensuring that the construction sites sort the waste or sort it more correctly, some of the materials can instead of being burned, be recycled, upcycled or downcycled instead. This will further affect the economy of the company because the sorting will lead to that they have to pay less to the waste collectors. This project will focus on the economical perspective of waste management since better waste management is more likely to happen if it has a positive effect on economics.
The analysis will be made from a program management perspective since we are looking into waste management on multiple construction sites. In the following, program management methods, we are expecting to use, will be described.
Maslow's Hierarchy of Needs
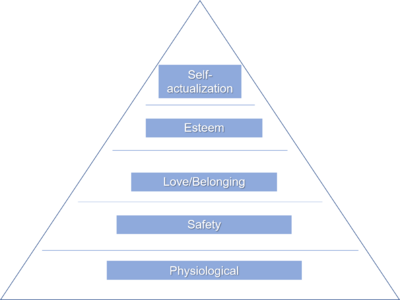
The "Hierarchy of Needs" theory was written by a psychologist named Abraham Harold Maslow through studying the lives and motivation of people who were successful like Eleanor Roosevelt and Albert Einstein. Humans, in general, are motivated with needs that are unsatisfied and basic needs to be satisfied before the complex ones. Maslow divided his pyramid into five different types of needs i.e. physiological, safety, love, esteem, self-actualization. The urge to satisfy the needs with time passing by increases, however people after gratifying the basic needs first moves onto the next on their mind.
The project managers with the help of this theory can create a hierarchy of needs to achieve their objectives since they are directly involved with the team. They need to understand the needs and motivation for the project's aims because in case of dissatisfaction the level of efficiency might be reduced. Therefore for an efficient and effective team, the project managers need to consider the factors and create a more flexible strategy in regards to needs and cultural background, etc. While some behaviours have more motivations, Maslow noted that any behaviour is determined by a multiplicity of basic needs rather than one.[2]
Physiological Needs
These are the basic needs that are for survival and are universal for human beings. Primarily these needs should be satisfied in order to be motivated towards higher needs i.e. breathing, sleeping, eating, etc. Unless these needs are met other needs are unfulfilled. This aspect is essential for a project manager and it needs to be satisfied with the team since physiological conditions are critical. Facilities should be available to the team members such as eating, drinking and resting while enough rest is required before work.
Safety Needs
Safety needs are second after physiological needs are gratified. Humans will usually think about their safety, which helps them to be consistent and stable. Categories of safety can be freedom from fear, dependency, security, stability, etc. The project manager needs to focus on the safety needs of their team after physiological needs are met. The project manager needs to understand the psychology of each team member and needs to create an environment where the team members feel secure. The project manager also needs to make sure that the team members receive their salaries in time, are healthy and safe. The team members must not be in fear of getting fired due to minor faults otherwise they will not be able to work as efficiently.
Love/Belonging Needs
The fact that humans are social animals, therefore, it makes them feel good when they are part of a team/group or around loved ones. The absence of this can cause a person to be depressed, cause social anxiety and loneliness. In terms of management's perspective, belonging to the team is one of the most critical needs. It is the duty of the project manager to create an awareness of being a team within each member and bring them together by arranging social events. This way collaboration becomes smoother and there is efficiency in the team. The members work better when they feel they are a part of a team towards a common goal. The team members should also feel like they are treated equally and with justice as well as respect or else they might lose the feeling of being an equal team member.
Esteem Needs
Esteem can be of two types, self-esteem which is a product of becoming a master in a particular task while the second one is being respected and given attention from the team members. After a person's needs for belonging is satisfied, they want to see recognition and respect in life. For example, when a scientist makes a breakthrough and receives an award, they will see respect from the community which satisfies their level of self-esteem, while it is also imperative that a person builds their self-esteem internally. From a project management perspective, a project manager should essentially show respect to the team members and appreciate their contribution to their team to boost their esteem. This makes the team members more confident and creative while project managers should also satisfy their own esteem needs.
Self Actualization
This is the top of the hierarchal pyramid of needs, in which Maslow argues a person ought to be what he is. In other words, a person who loves music must make music, while an artist must produce art which is essentially called self-actualization. Finally, Maslow argues, curiosity and need for knowledge is the top of the pyramid. In the scope of project management, for a project manager, it is important to identify the motivation of a team member to be in the team, since it is different with each individual. In the process of team building, the project manager should learn the team member's purpose and their expectation. When the team member has a specific interest in the project and curious for gaining knowledge, the chance of success of the project increases. [3]
Benefits
Maslow's Hierarchy of Needs is an important perspective for project managers to understand their team members' needs and motivations. They can use such information to create the most efficient work environment which will aid the quality of the project and also the progress.
Limitations
There are certain limitations for Maslow's perspective which are stated in the following:
- For different people the motivation is different such as to some love is more important than self-esteem.
- People who are privileged and have never experienced any lack of basic needs can undermine its importance.
- Some people can undermine other values for sake of their own beliefs such as religion, national identity, etc.
Business Model Canvas
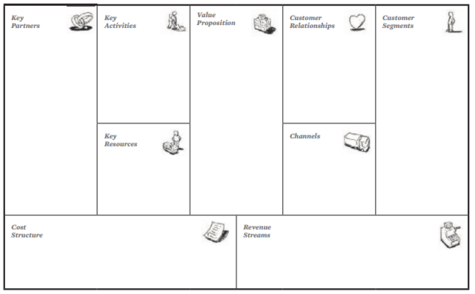
A business model canvas shows how a corporation produces, delivers and captures value. The business model canvas can be best portrayed through nine fundamental structure obstructs that show the rationale of how an organization means to bring in cash. The nine squares spread the four primary territories of a business: clients, owner, infrastructure and finance. The business canvas model is a strategical outline that has to be executed throughout the corporation for achieving the maximum success rate.
The 9 foundation stones of the Business model canvas are as follows:
- Consumer segments: The Customer Segments Building Block characterizes the various segment of individuals or organisation an endeavour expects to reach and serve. Clients include the core of any plan of action. Without profitable clients, no organization can get by for long.
- Value Proposition: The Value Propositions Building Block portrays the heap of items and administrations that make esteem for a specific Customer Segment. The Value Proposition is the motivation behind why clients go to one organization over another. It takes care of a client issue or satisfies a client need.
- Channels: The Channels Building Block depicts how an organization speaks with and arrives at its client segments to convey a Value Proposition Correspondence, dispersion, and deals Channels involve an organization's interface with clients. Channels are client contact focuses that assume a significant job in the client experience.
- Customer Relationships: The Customer Relationships Building Block depicts the kinds of connections an organization sets up with specific customer segments. An organization ought to explain the kind of relationship it needs to build up with every customer segment. Connections can run from individual to mechanized.
- Revenue Streams: The Revenue Streams Building Block speaks to the money an organization creates from every Customer Section. On the off chance that clients involve the core of a plan of action, revenue streams are its conduits. An organization must ask itself, for what esteem is every customer segment really ready to pay? Effectively responding to that question permits the firm to produce at least one Income Streams from every customer segment.
- Key Resources: The Key Resources Building Block depicts the most significant resources required to make a plan of action work; each plan of action requires key resources. These assets permit an endeavour to make and suggest a value proposition, reach markets, keep up associations with customer segments, and procure incomes. Different key resources are required relying upon the kind of plan of action.
- Key Activities: The Key Activities Building Block depicts the most significant things an organization must do to make its plan of action work; each plan of action requires various key activities. These are the most significant moves an organization must make to work effectively.
- Key Partnerships: The Key Partnerships Building Block depicts the system of providers and accomplices that make the plan of action work. Organizations fashion associations for some reasons and associations are turning into a foundation of numerous plans of action. Organizations have collaborations to enhance their plans of action, diminish chance, or get assets.
- Cost Structure: The Cost Structure depicts all expenses acquired to work a plan of action. This structure square portrays the most significant expenses brought about while working under a specific plan of action. Making and conveying esteem, keeping up customer relationships, and producing income all bring about expenses. Such expenses can be determined generally effectively subsequent to characterizing key resources, key activities, and key partnerships. [4]
Benefits
- Focus: The Business Model Canvas is intended to directly consider every one of the key parts or building blocks for formulating a plan of action. Currently, it permits businesses to see how every aspect identifies with others; how the capacities, exercises and procedures interlink and interlock. It gets you to consider your business in a progressively deliberate and formal manner. The Business Model Canvas mainly focuses the business on key components that matter the most and will have the best effect on the growth of the organisation.
- Speed & Agility: The key rule of the Business Model Canvas is to focus on quality instead of quantity. It's anything but an activity of filling in boxes (SWOT) or making a report. Or maybe, it is tied in with deciding the key contributions to each building block. It is fluid and dynamic in nature.
- Common Language: Business Model Canvas makes a typical reference and language that can be utilized to lucid, share and in this manner gain input on every plan of action and it's constituent parts. Its instinctive nature doesn't take any deciphering and is hence simple to decipher and expand. It gives a straightforward reference that it can be utilized internally, just as remotely with advisors, investors and partners.
Limitations
The limitations don't expressly concentrate on illuminating the torment of stakeholders in a given project. The Business Model Canvas additionally dismisses a Customer-centered Strategy and avoids an association's strategic purpose. Presently, the Business Model Canvas is an arrangement that is solution-focused as opposed to pain disclosure, learning, and end centred.
Star Model
The Star model is an organization design framework that management use to influence the behaviour of the employee. The Star model design policies have five different categories used as tools to shape the decisions of an organization effectively. [5] They are as follows:
Strategy
Traditionally, the first component to be addressed initially in the Star model is the strategy. It is a tool used to determine the direction of the organization. It specifies different aspects of a company, like the objectives needed to achieve and the values of the company. It helps in identifying sources for the company's advantage.
Structure
It determines the location of authority/power for decision making. The policies are divided into four areas:
- Specialization, it refers to the numbers and the type of speciality required to complete the tasks.
- Shape, it refers to the number of employees in each department at every level of the company's structure.
- Distribution of power, it refers to the power movement within the departments dealing with different issues.
- Departmentalization, it refers to the formation of different departments at each level of the company's structure, they have usually formed in different dimensions i.e. markets, workflow, function, products and customers, geography, etc.
Processes
It shows the information flow and response to IT. This cut across the structure of an organization; after structure, processes is the second most important definition in the star model. The processes are in two ways,
- Vertical, it refers to the budget process and also business plan, allocating resources for talent and funding.
- Horizontal or lateral process, it revolves around the workflow i.e. launching new products or development, and/or customer order fulfilment which can be done through voluntaries or supervised teams.
Rewards
It is a system to motivate people for better performance and strive for the goals of an organization. To bring the goals of the employee and the organization on the same page. The policies are defined around raise, bonus profit or salary policies, etc. Other ways can involve awards, recognition within the company for tough assignments. It should be in harmony with processes as well as structure.
People
The last tool is towards the people where policies are made to define the skills of the employees. HR policies such as selection, recruitment or job training, etc are governed in this domain. Policies are always successful when they are more consistent with all the other design areas connected. HR policies help build the direction of the organization i.e. flexible company requires flexible workers and matrix organization requires employees who are able to solve conflicts, HR always develops employees and the capability of an organization. [6]
Benefits
The Star model has different benefits within an organization and in the overall management as well. The structure was the important aspect which most design efforts were put into without putting in much work in the other aspect. However, the Star model helps to recognize processes, rewards, people, etc. to be as equally important and worked on. Another benefit of the model is to identify and overcome any negatives within the structure. If the management identifies the negatives within the structure all the other policies can be designed to counter them.
Limitations
There are certain limitations for the Star model, stated as follows:
- It is limited in the calling out key elements including the inputs and outputs, as well as the performance.
- It also does not provide performance variables of the organization.
The Iron Triangle
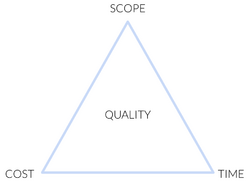
The project management triangle is known by various names such as Iron chart or Project triangle which basically portrays the basic idea of how crucial the three constraints are. Along these lines, it very well may be handily contended that the Triple Constraint may be the absolute most significant idea throughout the entire existence of the task. In the field of project management, the iron chart can be compared to the invention of the wheel. When coupled with the right project management tool the project is bound to be successful.
So, what are the threefold constraints?
- Cost: The money related limitations of an undertaking, otherwise called the task spending plan.
- Scope: The errands required to satisfy the undertaking's objectives.
- Time: The timetable for the venture to arrive at the finish.
The time limitation indicates the measure of time accessible to finish a job. The cost imperative refers to the planned sum accessible for the undertaking. The degree requirement refers to what must be done to deliver the task's final product. These three requirements are frequently contending essentials: lengthened degree normally implies expanded time and expanded cost, a tight time limitation could mean expanded expenses and diminished extension, and a strict spending plan could mean expanded time and decreased degree.
Essentially, the Triple Constraint expresses that the achievement of the undertaking is affected by its spending limit, cutoff times and highlights. As ahead of that project, you can exchange between these three imperatives; notwithstanding, changing the limitations of one implies that the other two will definitely endure a hit. The Triple constraints are an integral part of a successful project, though it does not determine the success of the venture. Cite error: Closing </ref> missing for <ref> tag
Advantages
- Easier to understand: The tasks can be complex and hard to understand when it is not visually represented, but the Gantt chart makes it easier for people to understand as most of us think in pictures.
- Organizes thoughts: The Gantt chart breaks down a complex problem into smaller processes which can be understood and solved easily.
- Depicts clearly what needs to be done: the Gannt chart if produced in a nice way with high-level tasks properly organized and the resources allocated accordingly, it clearly depicts if the project will be successful within the given timeframe or not.
- Helps set realistic time frames: The bars on the Gantt charts indicate the period of time required for a certain task to be accomplished.
- Its highly visible: it helps people understand the process better and the start and end dates of the projects as well. It also shows which part of the project is currently under progress and also the objectives of the project.
Limitations
- The Chart can get extremely complex: The number of people employed and resources used in the project can be quite large. Usually, software’s are used to take care of the complexity of the Gantt Charts, however when the project gets too complex a number of skilled people are required to manage the Gantt Chart.
- The size of the bar does not indicate the amount of work in the task: the bar on the chart only indicates the time frame of the task. It is not possible to estimate the number of resources that are actually required to complete a particular task.
- Need for constant update: There is always a need to update the chart constantly as the project gets bigger because as it gets bigger there are always changes associated with it. One of the disadvantages of not updating the Gantt is that it will be ignored if small changes are not updated in it.
- Difficult to see on a sheet of paper: Since the software products need to be viewed on the computer screen, which is usually viewed in segments to be able to see the whole project. It is difficult to show the details of the project to the audience. [7]
The Gantt Chart can be used effectively to plot all the activities in the project and can also include milestones with start and end dates. This way everyone involved in the project is clear about the tasks that are already in process and can even see the upcoming tasks and be prepared for it.
SWOT
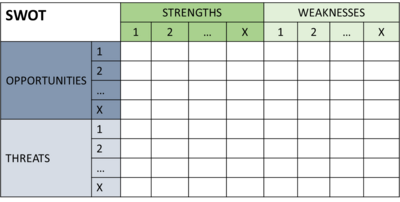
A SWOT diagram is used to establish an overview of a company’s current situation both external and internal and to find out the future direction of the company [8]. A SWOT analysis consists of 4 categories.
1) Strengths: Strengths are internal factors meaning that they represent the resources available within the company. The strengths should be build up within a company and lead to competitor advantages over other companies.
2) Weaknesses: Weaknesses are also internal factors and represent instead the problems within the company. The weaknesses should be set in focus so the company is aware of them too so it can either work around them or improve them. These can be used to set the operational and people goals.
3) Opportunities: Opportunities are external factors since they describe the things that are going on in the relevant societies and markets that the company could potentially benefit from. This in terms of what the company should invest its money in and which future goals they should aim for.
4) Threats: Threads are also external factors since the movement of the society and markets can also thread or limit the companies to such an extent that they are forced to take action. Threads should be monitored until they either disappear or becomes bigger and action should be taken [9].
The categories should be listed in a SWOT diagram as shown in the picture. Based on the intersections between the categories, the final strategy for a company can be planed out. The method should make it clear where the future for the company lies. Should the company try to improve themselves by focusing on their current weaknesses or should they instead rely on the strengths the company does already have? [10]
Benefits
The SWOT analysis is a nice tool to simplify a huge amount of data so it becomes more manageable. For the company, the results can be an eye-opener to what potential threads and opportunities markets and societies can provide. When a goal is set for the company the method can also be used to identify which other tools could come in hand to reach the final goal.
Limitations
The method is great since it simplifies a huge amount of data. The downside to this is that the model could also end up being simplified too much and key points could be left out. If no simplifications are done, on the other hand, the model could end up very big and confusing. The analysis is not really including any limitations in terms of the level of detail or level of simplification which could both be a problem. Another limitation of this method is that the result is only reliable with the exact data given in the analysis. If anything changes or if unknown factors appear it could have a great impact on the final result. There are also no requirements for the level of actual data required for the analysis and the result is therefor only as reliable as the inputs. Because of that, it should also be taken into consideration who did the analysis since the result could be coloured form this. [11]
Expectancy Theory
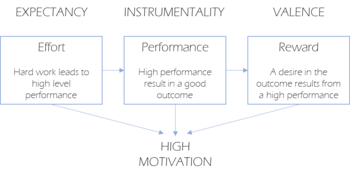
Expectancy theory is a motivation theory build on the expectancy of a good result or outcome. It covers the three factors that determine a person’s motivation; expectancy, instrumentality and valence. The level of expectancy in an outcome determines the level of effort which is expected to be needed to get a certain result. If a person believes that a high level of effort leads to high performance the motivation will be high.[5]
In order to achieve a good outcome, both the expectancy and the motivation must be high. It is the manager's responsibility to ensure the workers are motivated and believe that a high effort leads to high performance and result in a good outcome.
Instrumentality describes the perception about the level of effort which will lead to a good outcome. People are motivated to perform high if only the think a high performance will lead to a good outcome or result.
In expectancy theory, the valence is important to consider when motivating employees. The desirable outcome is different from person to person, so to ensure a high motivation it is important for a manager to know what has a high valence. This can be pay, accomplishment or enjoying work.
If all these three factors are high the motivation will be high. On the other hand if one of the factors are low, the motivation is most likely to be low.[5] Regarding waste management, the theory can be relevant to use as waste sorting is a new or improved procedure that needs to be implemented. The motivation to do that for the craftsmen is important to get the desired outcome – better waste sorting.
Benefits
The theory is good to use when motivation is a high priority or issue in the desired goal. As motivation does not come by itself, the theory is relevant as it describes the expectancy behind the motivation an not only the motivation itself.
Limitations
The theory is very simple - motivation needs to come from a high valence. Motivation might be bigger than that or more complex than it is possible to detect with this theory.
Fish Bone Diagramme
A fishbone diagram is used to identify the cause/causes of an effect or in other words, to look at a problem and its origin/origins. The diagram has its name from the visual structure of it but is also referred to as the Ishikawa diagram, which is the name of its creator. The procedure of using the diagram can very easily be divided into four steps as shown in the figure. [12]
1. First, the effect that is going to be investigated is defined in a box on the right side of the diagram.
2. A horizontal line is drawn from the effect box, creating the spine of the fish.
3. All causes of the effect are defined and attached to the spine creating the rest of the bone structure of the fish. Examples of causes could be the six M’s (Materials, Methods, Machines, Mother Nature, Manpower and Measurements ) or the six P’s (People, Process, Policy, Plant, Program and Product). The causes of the effect can be found by brainstorming or waste walks [13].
4. Sub-categories are then defined and attached to the causes.
The diagram creates an overview of the causes of a problem and therefore defines which changes should be made in order to resolve a specific problem.
This tool might come in hand when we have to identify the causes behind why too big amounts of materials are sent to incineration rather than to reuse.
Benefits
The method supports idea generation for the root causes of a problem. The more brainstorming and reflecting the bigger the opportunity becomes for finding the necessary change that solves the investigated problem. From the diagram, the causes get also visualized which means that it gets easier to get a quick overview of causes. This can be used to give the stakeholder an easy overview of the causes behind the problem. Furthermore, it also makes it possible to hold root causes up against each and thereby to get an overview of which root causes is repeated and therefore is important. [14]
Limitations
One of the disadvantages of the model is, that depending on the complexity of the problem the diagram might get more compressed and hard to navigate in and the clear overview might be ruined. Also, it can be hard to connect the root of the main problem across many different causes.
Efficiency and Effectiveness Matrix
The efficiency and effectiveness matrix is a commonly used project management tool. The main purpose of the tool is to recognize and detect the courses of low efficiency and effectiveness in the current situation so it can be improved. It is a tool that strives to reach the goal for a high performance regarding providing a service or product for the costumers. Efficiency measures how well the resources are used to achieve the goals and effectiveness measures how appropriate the goals are.[5]
The matrix consists of two axes; a vertical which goes from low to high and a horizontal going from low to high. This matrix creates four boxes; low efficiency/low effectiveness, high efficiency/low effectiveness, low efficiency/high effectiveness, high efficiency/high effectiveness. [5]
- Low efficiency/low effectiveness: The wrong goals are being chosen and the resources are used in a poor way which results in a low-quality product that is unattractive.
- High efficiency/low effectiveness: The wrong goals are being chosen but the resources are used in a good way which results in a high-quality product that is unattractive
- Low efficiency/high effectiveness: The right goals are being chosen but the resources are used poorly which results in an attractive product that is too expensive
- High efficiency/high effectiveness: The right goals are being chosen and the resources are used in a good way which results in an attractive product that is affordable
In the case of waste management, the tool can be useful to detect the courses of why waste sorting on building sites are not working and help to figure out how to improve that.
Benefits
The efficiency and effectiveness matrix is good to show the current situation in a company. It can provide an overview of how the efficiency and effectiveness of a company is and help in the process of improving the two factors.
Limitations
The matrix provides an overview of the situation in the company or organization. It is up to the user of the matrix to decide the way to use it and thereby the detail level. It is important to use a certain level of detail to be able to use it properly and to get a useful outcome. It can be easy just to use it with a low level of detail which will not lead to a useful outcome.
Value Propositions Canvas
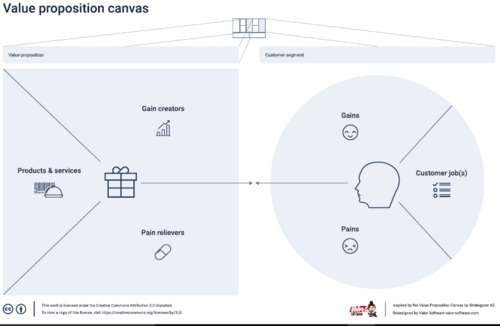
The value proposition canvas is a tool that helps us ensure that a product or service suits the needs of the customer segment and also helps us to deliver a product or a service that is valued by the customers. The canvas was invented by Dr Alexander Osterwalder as a framework so as to ensure that the product or service is designed to fit into the market. The tool can be used when an existing product needs refinement or when a new product is being designed from the start. The value proposition canvas usually is made up of two different blocks which are the value proposition offered by the company and the customer profile. The customer profile is important because it is what adds value to the company’s offering.
The customer profile consists of 3 main features, that is,
- Pains: Pains can be the negative emotions, risks, and experiences that a customer has to undergo in the process of getting the job done.
- Gains: The Gains talk about what is actually desired by the customer from the product and also speaks about what would increase the chances of the customer adopting the value proposition of the company.
- Customer jobs: Customer Jobs can be defined as the job that the customer is trying to do, it can also be a problem that has to be solved by them or a wish they need to satisfy. The tasks that a customer needs to fulfil can be social, emotional or functional in nature.
A separate profile has to be created for different customer segments as each segment is unique and has a well-defined set of pains, gains, and jobs.
On the other hand, the value proposition consists of,
- Gain creators: It defines how the service or a product adds value to the customer and creates gains
- Pain relievers: It describes how the product helps customers overcome their pains in doing a job.
- Products and services: It speaks about the service or a product which creates gains and relives pains which in turn creates value to the customers.
After listing out both the blocks of the value proposition canvas a fit is achieved when the product addresses the most significant pains and gains from the customer’s point of view. [15]
Benefits
The Value proposition canvas is a great tool which helps in determining the needs of the customer which in turn lets the company design Business model in a way that it perfectly matches the customers' demands. The method used in the canvas for the collection of customer data is fairly simple. By determining the needs and requirements of the customer, the business models of the company can be effectively designed. This makes sure that no time is wasted in designing products or services in which the customer might not be interested and eventually lead to profitability. [16]
Limitations
- Not looking at the value proposition canvas as two separate building blocks: It is important to be able to distinguish between the two elements of the Canvas. The customer profile is something that gives the user some idea about the customers' preferences and needs. The things that are mentioned in the customer profile are outside the direct control of the company. Whereas, the Value Map contains the jobs, pains and gains of the targeted customer segment and is within the realm of control.
- Mixing several customer segments into one canvas: Mixing several segments of customers into one canvas is a common mistake the companies make. This can cause a lot of trouble as different segments of customers to have different pains, gains and jobs. Mixing up of the segments cause a lot of confusion in which segments information is being observed.
- Creating a customer profile through the lens of your value proposition: It is important to be able to observe the customer segment without any bias. Most of the times it so happens that project managers only start listing the jobs, pains and gains in such a way that the product or service that is developed is able to solve all this. They fail to see what the customer really needs and what are the reasons that are making them behave in a particular way
- Focusing only on functional jobs: Once the customer profile is completed then the customer job is labelled as functional, emotional or social in nature. But most commonly managers tend to label the job as functional but it is really important to think beyond and realize the social and emotional jobs that are actually pushing the customers.
- Trying to address every customer pain and gain: It is a common tendency to link every pain, gain and the job of the customer profile to the value map. But it is unrealistic to believe that the product can satisfy every aspect of the customer profile. Trying to achieve this a waste of time that can be used to do better things and as a result, people end up not performing well in any one of those things which will, in turn, leave the customer unsatisfied. [17]
The Value Proposition Canvas can be an effective tool to help us understand how sorting of wastes efficiently can provide value and save money to MT Højgaard.
Problem Tree
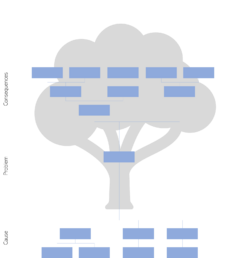
A problem tree is a central tool of many project planning. The function of this tool is to find solutions to the problem by mapping the causes and effects. This is done by using a similarly essential tool as in mind mapping, but where the structure is a focus element in this method. The solution will be a prioritised presentation of a problem, its causes and consequences.
A problem tree is a tool based on the general tree diagram, which is a tool used to communicate the hierarchy of elements in a project and to clarify the relations the between main, subordinate, and supporting ideas. [18]
The use of the tool is divided into four parts [19]
- First a brainstorming is used to identify the major problems of a project. Each of these problems may result in a problem tree analysis. One problem is chosen.
- The possible causes to the problem are defined. The causes might be responsible for the problem situation but can further be causes of other causes. The causes can have internal relationships or be directly related to the main problem. All causes are being listed.
- When all causes are found, the consequences can be defined. As the causes, the consequences are being listed with their internal relationships.
- When all elements of a specific problem have been identified, the problem tree can be presented. It is viewed as a tree, where the causes are the “roots”, the main problem is the trunk and the consequences of the crown.
Benefits
The advantages of using the problem tree are understanding the problem by breaking it down. By doing it in this way, the chunks will be easier to analyse and understand. Further, these will be more manageable when chunking up and down. By expand and elaborate the problems, causes and effects it might be easier for all stakeholders to understand, because of a shared sense of purpose and action. This will clarify the processes in the different stages, and the different stakeholders and participants will be related and connected to specific parts. The issues forward will further be identified and thus handled early in the process, which e.g. can prevent a leak in the budget. [20]
Limitations
The problem tree is often a tool used in an early stage of the process, because it can form a good and common understanding of a problem. But by try finding problems affected by others in a that early stage of a process, some problems may be ignored or neglected, and the solutions can be subjective. Further, the analysis is not ranking the problems based on size of the issue or importance. This means, that all issues may seems equally and thereby that all are very important.
Stakeholder Analysis
The stakeholder analysis is a way to manage the stakeholders in a project, which is often used by project and program managers.
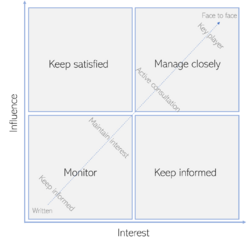
A stakeholder analysis is a process of identifying people, which is involved, affecting or affected by the project or the problem going to be solved. The focus is to map them in groups of interest and influence and find out, e.g. how to communicate with each of the stakeholders to avoid conflicts. Further, this tool is a good way to define and understand the goals and plans for each stakeholder.
The analysis can be based on more tools. In the following, four different tools will be mentioned and explained. Current for all tools is, that the stakeholders have to be determined and identified at first. Stakeholders are basically all persons or companies, which have an interest or influence on the project scope; it is all from the general public to investors. The stakeholders can then be grouped by using tools.
- Stakeholder map: All stakeholders which either have an interest or an influence on the project are being identified. The stakeholders are being connected to each other to visualise their relationships and thereby point out the key players and their specific roles related to another stakeholder. [18]
- Interest/influence matrix: This tool can be used to classify the individual stakeholder's power and interest in the program and thereby appreciate the needs of the stakeholders. All stakeholders are placed in a graph based on their power or influence on the program. When placing the stakeholders their internal relation will be visualised. The tool can be used both before and after a project to see the change of mindset or value for the individual stakeholder.
- Stakeholder and benefit mapping: This tool is a scheme of interests and stakeholders. All stakeholders are placed on one side and all interest is placed on the other side. The parts are being connected crisscross. By using this tool, the most important and common focus areas can be identified.
The stakeholder analysis is an important tool to use in the case of waste sorting because the involved stakeholders have to be identified and their working routine have to be defined and analysed.
Benefits
The benefits by using the above-mentioned tools of stakeholder analysis are to effectively sort the stakeholders into categories. The tools can help identifying, monitoring and informing the different stakeholders in the correct way and thereby involve them in the right processes and decisions. By using these techniques, the stakeholders, which have an interest in the program, can be analysed and their needs can be covered as good as possible.
Limitations
The flow of the stakeholder's participation change throughout the project. Therefore, the analysis may be seen as a snapshot of the stakeholder's position, because of their power and interest changes within the different stages of the project. Furthermore, it is a subjective perception of the different stakeholders and therefore they will be treated and evaluated based on this view.
Five Whys
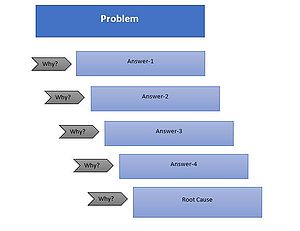
The technique Five whys is developed in the 1930s by a Japanese industrialist and inventor, but the method is still used today to encircle problems. The tool is aimed at people, which is working with the project and have hands-on experiences. This tool is meant for simple problems and not for critical problems because the method can lead multiple reasons and causes, but only one of these is chosen in the further development, and this can lead to pursuing of a single track. This can be a good solution when making decisions about minor problems, but not with complex issues.
By using the question of why, the focus area or objective of the project will be clarified. It is done by moving up in the hierarchy in the work breakdown structure and thereby find the essence of the project. The process of using the five whys is a simple process, where a team defines a problem and write it down. First why will be asked, and the team have to discuss why the problem has occurred. The most thorough issues are written below the problem. Four more whys are asked and the same procedure for the answers are being done. When all five whys have been asked, the root causes can be addressed, and the solutions that can prevent the problem can be discussed. [21]
Benefits
By using this tool both minor and major problems can be analysed by having a discussion about the five whys, and in this case, the issues around the project of waste management can be clarified before making big decisions.
Limitations
The technique can in some cases be very sketchy partly because the questions ends in a higher level than by the root cause, and therefore only deals with the symptoms instead of the real problem. Partly because it can be difficult to ask the right questions, which can lead to the root cause, and difficult to ask questions which is that open that it can result in new considerations and questions. The last issue occurred first time by use of this method regarding the case with MT Højgaard. The focus was at first to find the root cause, that the questions very fast were narrowed down in a way, that we could not ask more question.
References
- ↑ HAL, FBG. (2019, 27. 09). Byggeri. Byggematerialer står for 11 procent af verdens CO2-udledning. http://www.dagensbyggeri.dk/artikel/106962-byggematerialer-star-for-11-procent-af-verdens-co2-udledning
- ↑ A. H. Maslow. (1943) A Theory of Human Motivation. Originally Published in Psychological Review.
- ↑ Maslow, A,H. 3rd edition (1987). Motivation and Personality. HarperCollins Publishers.
- ↑ Alexander Osterwalder & Yves Pigneur. Business Model Generation.
- ↑ 5.0 5.1 5.2 5.3 5.4 Jones, Gareth R. and George, Jennifer M., Essentials of Contemporary Management, Sixth Edition, 2015
- ↑ Galbraith, Jay R. (2006, 06, 01). The Star Model. https://www.jaygalbraith.com/images/pdfs/StarModel.pdf
- ↑ Project Management (08/03/2020) https://project-management.com/advantages-and-disadvantages-of-gantt-charts/
- ↑ Charlotte Cederstrøm, IT Univers. (2012, 06. 02). SWOT, Charlotte Cederstrøm IT Univers [Video]. https://www.youtube.com/watch?v=3TEvSusjvNU
- ↑ OnStrategy, Virtualstrategist. (2016, 19. 10). How to Perform a SWOT Analysis [Video]. https://www.youtube.com/watch?v=I_6AVRGLXGA
- ↑ Jones, Gareth. & George, Jennifer. (2015). Essentials of Contemporary Management (6. edition.). MC Graw Hill.
- ↑ Gaille, Brandon. (2017, 10. 01). 9 SWOT Analysis Pros and Cons. Brandongaille. https://brandongaille.com/9-swot-analysis-pros-and-cons/
- ↑ David M. Williams, HarvardX. (2017, 19. 04). How to create cause-and-effect diagrams [Video]. YouTube. https://www.youtube.com/watch?v=mLvizyDFLQ4
- ↑ Jeff Hajek, VelactionVideos. (2009, 17. 07). Cause and Effect Diagram Training Video (aka Fishbone Diagram & Ishikawa Diagram) [Video]. https://www.youtube.com/watch?v=bNDlg1h-za0
- ↑ Firican, George. (2018, 05. 12). How to use the fishbone diagram to determine data quality root causes. https://www.lightsondata.com/how-to-fishbone-diagram-data-quality-root-causes/
- ↑ . B2B International. (08/03/2020) https://www.b2binternational.com/research/methods/faq/what-is-the-value-proposition-canvas/
- ↑ Mulder, P. (2017). Value Proposition Canvas. (08/03/2020) https://www.toolshero.com/marketing/value-proposition-canvas/
- ↑ Garner, Benson. (19.02.2015) 5 Common Mistakes to Avoid When Using the Value Proposition Canvas. (08/03/2020) https://www.strategyzer.com/blog/posts/2015/2/19/5-common-mistakes-to-avoid-when-using-the-value-proposition-canvas
- ↑ 18.0 18.1 Martin, Bella; Hanington, Bruce, 2012. Universal Methods of Design – 100 Ways to Research Complex Problems, Develop Innovative Ideas, and Design Effective Solutions. Rockport Publisher
- ↑ Thakur, Sidhart, 2020. Using a Problem Tree Analysis in Project Management. https://www.brighthubpm.com/project-planning/118441-problem-tree-a-comprehensive-analysis-tool/
- ↑ Overseas Development Institute (ODI). 2009. Planning tools: Problem Tree Analysis. Successful Communication: A toolkit for researchers and civil society organisations. https://www.odi.org/publications/5258-planning-tools-problem-tree-analysis
- ↑ Lean Enterprise Institute. (19.07.2018) The 5. Whys [Video]. https://www.youtube.com/watch?v=SrlYkx41wEE.
