Fault tree analysis
Fault Tree Analysis
Fault tree analysis (Hereby noted as FTA) is a technique primarily used within Risk analysis. It provides a visual representation of an undesired event, as well as the dependencies of said event, thereby allowing one to identify and analyse what factors can contribute to this event, also called base events. Finally, it allows one to calculate the probabilities of the top event. Unfortunately, the FTA has certain limitations, as with all models, and as such, they are not sufficient alone to analyse all risks in a project. Nevertheless, FTA is a very powerful tool in managing risks, and allows for good visualizations of events and allows a displined, highly systematic, flexible approach to analysing these risks.
This article will consist of four sections:
- Big Idea: This section will explain the concept of FTA, as well as show an example of a fully developed Fault tree. It will also briefly explain the history of FTA.
- Applications: This section will explain how to use FTA.
- Limitations: This section will explore the limitations of FTA.
- Annotated Bibliography: This section will provide key references that can be read for further elaboration on FTA.
Contents |
Big Idea
Concept
FTA is a top down analysis where one identifies the undesired state and places it as the top event, then goes through all intermediate events and draws their connection to the top event through various gates, and finally, once all intermediate events have been discovered and the base events are reached, these are added as the root of the trees.
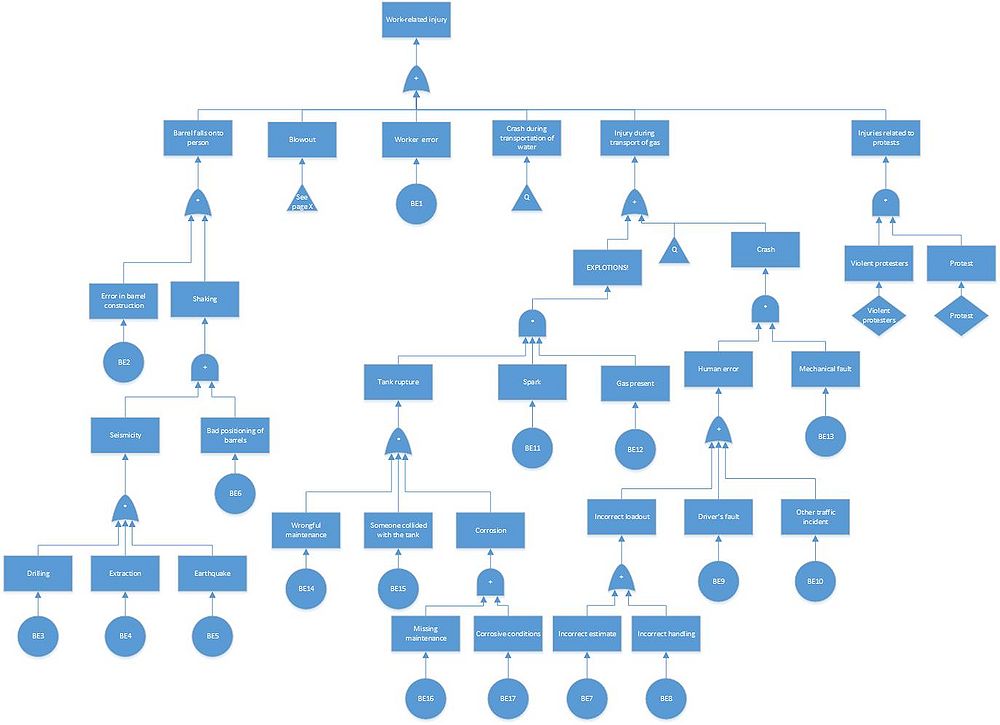
Figure 1 shows a fully developed fault tree. It is rather large fault tree, however, but it shows how one can choose a top event and then, through developing each intermediate event, reach the bottom of the tree. The triangles, in this particular case, refers to other fault trees developed in this case, and including these would have made the tree even larger and would have been counterproductive.
History
Fault tree diagrams were originally invented in 1962 by the Bell Telephone Laboratories. They did this on behalf of the US Air Force in connection with the Minuteman ICBM launch control system. It was very succesful, and were subsequently adopted by the Boing Company, then the US army, then US government and, in today's world, it is used widely in System Safety and Reliability Engineering, as well as many other major fields of engineering, and can be applicated to almost any project that needs to know the effect of various events and how they connect with other events.
Applications
Basic fault trees
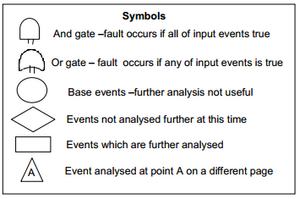
A basic fault tree consists of 6 different symbols. Of these, two are gates and 4 are events, as seen by figure 2.
- And gate: An And gate has two or more inputs and one output. If all inputs are true, then the output will be true as well, thus causing the event above the gate, but if just one event is false, the event above will not happen
- Or gate: Or gates are mostly the same as And gates - where they differ is that only one input has to be true to cause the above event, and all inputs has to be false to not cause the above event
- Base event: An event that is not analysed further, meaning that it could either not be broken down into further detail, or doing so would be counter-productive. In the example of figure 1, base events are the roots of the tree, and denoted BE1, BE2, BE....., BE13, for the 13 different base events in that specific case.
- Event that is not analysed further: This group of events are usually events that lack data, meaning that further analysis is meaningless.
- Event that is analysed further: Intermediate events that are analysed further.
- Event analysed on a different page: Used as a link to make huge Fault trees into smaller trees, allowing for a better overlook.
These 6 symbols are then used by defining the top event (also known as the undesired event) and breaking down what events could cause this event. Once these events have been identified and paired with the top event through and- or Or-gates, the next round of intermediate events are broken down into new intermediate events and connected through gates. This process continues until further analysis is unproductive, thus resulting in base events.
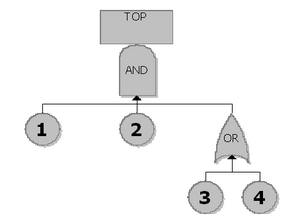
Once a fault tree has been finished, a minimal cut set can be calculated. This minimal cut set is a set of the minimum amount of base events that will cause the top event - in the example of Figure 3, the minimal cut set is either {1, 2, 3} or {1, 2, 4} since either of these three events together will cause the top event. What makes these cut sets especially neat are the fact that they give an easy overview over the easiest path to the top event, and these minimum cut sets also displays which basic events are both necessary and sufficient to produce the top event. This minimum cut set can then be used to generate a new fault tree, and through this fault tree, provided that the probability of the base events are known, it is possible to calculate the probability of the top event.
Advanced Fault trees
Once a user has understood how to make the basic fault trees, there exist several additional type of gates, as well as two additional events. These are as follows:
Gates:
- Voting Or: Voting Or acts as a normal Or gate, except that "k" or more input events must be true before output occurs. Symbol: Like an Or-gate, with "k" in the middle, where k is an integer with the amount of inputs that must occur for the output to happen.
- XOR, also known as Exclusive Or: Exclusive Or is a gate that only allows the output to happen if and only if one input is true and all other inputs are false. Symbol: An Or-gate symbolized inside an And-gate
- Priority And: This type of gate lets the output occur if the input happens in a specific sequence. Depiction varies, but typically like an And-gate with an extra flat line in the bottom.
- Inhibit: Inhibit gates allows for a certain output to happen in case the input occurs while an enabling condition is also true. Depiction: A hexagon with inputs from below, outputs on top, and conditioning events from the side.
Events:
- External Event: An event that is assumed to occur, always. Traditionally has a fixed probability of either 0 or 1. Depiction: A square with a triangle on top.
- Conditioning Event: This type of event typically occurs in combination with Inhibit gates, but can actually be used in combination with any other gate as well, setting a specific condition for the gate that it is applied to. Depiction: An ellipse that is layig down.
Strengths
FTA possess several strengths. These are as follows:
- Highly systematic, disciplined, flexible approach
- Attention on failures directly related to top event
- Displays all interfaces and interactions in systems
- Easy understanding of the cause and effect
- Provides a method to do logic analysis on the top event
To elaborate, FTA has a highly systematic, disciplined approach when it comes to modelling. Typically, such models are inflexible when it comes to modelling many different factors - however, FTA allows for precisely this, thus remaining flexible as well. Furthermore, the structure of FTA allows for several strengths, too: First of all, the fact that FTA is a top down approach means that the attention of the analysis is automatically focused on failures directly related to the top event. Secondly, since the structure allows for displaying all interfaces and interactions in the analysed system, it is very useful in systems that possess many of such interfaces and interactions, simply because it allows for a nice overview of all the interactions between these. In a more general sense, the structure of FTA actually allow the viewer an easy understanding of cause and effect in any system that it is applied to, however, larger systems may need to be split up into several trees to keep this easy understanding property alive. Finally, FTA enables logic analysis to be applied on the fault trees due to the fact that there are only binary states, thus allowing for the minimal cut set to be found, allowing for a simple way of finding failure pathways that might otherwise have been missed.
Limitations
Just as FTA has several strengths, so there are several limitations in the FTA model. Below follows a brief overview, followed by an elaboration on each subject.
- Uncertainties in the probabilities of the top event
- The whole picture is not discovered
- FTAs are a static model
- Fault trees only possess binary states
- Human error is not easily included
- Large
- FTAs do not easily enable domino effects
Uncertainties in the top event: Due to the fact that the probability of the top event is calculated from the probability of the base event and the interconnected events, if the probability of the base events are not known accurately, it will cause uncertainty in the rest of the system.
The whole picture is not discovered: Sometimes, causal events are not discovered, or intermediate events are missing, thus creating a fault tree that does not cover the entire system. In this case, it prevents probability analysis until the events are discovered.
FTAs are a static model: Since FTAs are static models, time is not taken into account in the model.
Fault trees only possess binary states: Fault trees only possess binary states, and as such, partial failures cannot be represented in these trees. This means that a component that fails partially, such as a Tank Rupture in Figure 1 (thus failing), but no oil spills out (but only fails partially), cannot be depicted.
Human error is not easily included: Since human error varies greatly, and since Fault trees only posses binary states, one either has to include a lot of different events to compensate for possible human failure, which clouds up the diagrams, or simplify it with a simple "Human error" state, which does not show the complete picture. As such, showing human error in fault trees is not easily done.
Large: As systems grows more complex, so will the fault trees. As a result, in the modern time where many systems are interlinked, fault trees might easily become very large and complex to both generate, understand and work with. Various computer tools can reduce this effect, but such tools must first be obtained and understood, thus reducing the effect of the simplicity of FTA. Furthermore, every tree may be split up into multiple trees through the link, such as Figure 1, but even with this as well, Figure 1 is still a large and complex tree.
FTAs do not easily enable domino effects:
Annotated Bibliography
Risk Management - Risk Assesment Techniques, Dansk Standard, 2010. The Danish standard for risk management techniques, provides the Danish standard on how to do FTA.
[[1]], visited the 13/9, 2015. Provides further details on FTA
[[2]], visited the 20/9, 2015. Explains what a minimum cut set is in detail.
Sample Code snips
This is a list
- List1
- List2
- List2
This is a picture
This is big, italian and underlined * You can choose to work on one of two types of articles: *
Here's some links
Articles Fall Term 2015 User's Guide Configuration settings list MediaWiki FAQ MediaWiki release mailing list Help Content
Aaanndd some references


