Integrated Cost and Schedule Control
It is generally known that without a good planning it is rather difficult to implement a project successfully. However, appropriate planning does not guarantee a successful execution of the project because the future is highly unpredictable and uncertain. Therefore, it is really important to control how the different tasks are progressing. In order to get an overview of the current situation of the project, we should compare the actual state with the planned program in terms of Scope, Schedule and Costs.
When it comes to measuring project performance, the planned schedule can be compared to the accomplished one (Schedule Control). But at the same time, the budgeted cost and the actual cost can also be balanced (Cost Control). Nevertheless, if these aspects are analysed separately, one can initially think that if a project meets the objectives of cost, it is on plan, but the truth could be that it is in reality delayed. In cases like the previous example, how do we actually know the overall situation of the project? How can delays be compared with monetary data? A very useful method to achieve all this goals without subjective interpretations of the reality is the Earned Value Management (EVM) technique, which will be one of the main topics developed in the present article. Moreover, with this method you can not only evaluate the performance of the project at any time, but also analyze future trends to estimate the cost and time of completion of the project.
Contents |
Background
According to PMI's PMBOK® Guide[1]:
The Monitoring and Controlling Process Group consists of those processes required to track, review, and orchestrate the progress and performance of the project; identify any areas in which changes to the plan are required; and initiate the corresponding changes. The key benefit of this Process Group is that project performance is measured and analysed at regular intervals, appropriate events, or exception conditions to identify variances from the project management plan.
Therefore, the control of schedule and cost should be part of the mentioned Monitoring and Controlling Process Group. Furthermore, controlling the performance of the different tasks shouldn't be understood as an isolated activity, but has to be present during all the lifecycle of the project. This fact is clearly reflected in the PMI's PMBOK® Guide[1]:
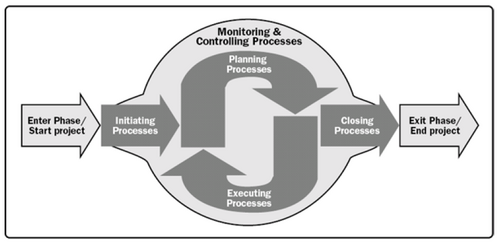
The integrative nature of project management requires the Monitoring and Controlling Process Group to interact with the other Process Groups, as shown in Figure 1. Monitoring and Controlling processes occur at the same time as processes contained within other Process Groups. Thus, the Monitoring and Controlling Process is pictured as a “background” Process Group for the other four Process Groups shown in Figure 1.
Once this global perspective of when to control a project is comprehended, one can move on to identify the different tools and techniques that can be used regarding the control of schedule and cost. First of all, the Judgment of Experts is a really important method regarding the interpretation of the data coming from the observation of how the project is developing. The main objective of this method is to determine which are the actions that the project manager, together with his team, decides to implement to ensure that the actual performance meets the planned requirements. Secondly, the use of Analytical Techniques can provide an overview of how the project is going to develop and help to prognosticate the way things are going to turn out. Examples of these tools are Root cause analysis (RCA), Forecasting methods, Failure mode and effect analysis (FMEA), Fault tree analysis, Variance analysis and the one developed below in this article, the Earned Value Management technique. Thirdly, by using the Project Management Information System you can access performance indicators, records and financial data that will definitely help in the process of monitoring and controlling project work process. Finally, the use of Meetings including project team members and stakeholders are also very useful. [1]
Over the years, all these different techniques have been used to control cost and schedule, but usually such supervisions have been done separately. However, the best option concerning the objective of obtaining an overall impression about how the project is progressing is to integrate the control of both aspects. Therefore, even when the two first methods (Schedule Control and Cost Control) are also interesting and will be shortly described, the main method developed in this article is the EVM. This tool was developed by the US Department of Defense in 1967 and later used successfully for monitoring DOE projects, in particular the US LHC accelerator project. [2]
Benefits
The main rewards that can be obtained by controlling the cost and schedule of the different tasks of a project and that describe the purpose of this tool, are stated below[3]:
- Achieving better management visibility.
- Developing disciplined planning.
- Planning and meeting the expectations of realistic schedules.
- Developing achievable objectives.
- And, finally, the project ending on schedule and within budget.
Application
Each project has its own characteristics and specifications. Therefore, even though some big companies have their own universal control systems, which they apply to all their projects, each one should be analysed and controlled in a different way. Complex, large and unusual projects require much more attention than those which are small and simple. This is because in those cases risk and loss to the company are lower than in the previous ones. Additionally, few controls will end in lack of knowledge of the project status, whereas too many controls are really costly and can even prejudice the course of the project. [4]
Besides all those cases when the application of the current technique is used to achieve the benefits mentioned before, it is also a great tool concerning the “Learning by Doing” philosophy. By controlling the schedule and cost of a project, you can analyse which factors have gone wrong, the reasons of these problems and thereby, improve the planning and performance of future projects.
Schedule Control
Schedule Control is understood as the process of monitoring the status of project activities to update project progress and manage changes to the schedule baseline to achieve the plan [1]. Moreover, the main reason to use this type of control is to minimize risk by recognizing deviations from the planned schedule and taking corrective and preventive actions.
In order to perform the Schedule Control, the next steps should be followed [1][3]:
- Development of schedule using management tools such as the Work Breakdown Structure (WBS), Scope Baseline and the Work Packages, which give information of the tasks that need to be completed in terms of resources needed, time to complete it, budget, required inputs from other tasks, sequence of activities, etc.
- Communication of the schedule using, for example, a Gant Chart.
- Evaluation and information of how the project is being accomplished. The feedback can come in different forms: verbal communications, written daily reports from the field, labor‐tracking reports, material deliveries, milestones achieved and upcoming activities. [4]
- Comparison of the actual project performance against the project management planned schedule. The monitoring and comparing process reveals the activities that are ahead of schedule, on schedule, and, most importantly, behind schedule.
- Identification of problems comparing the planned schedule to the executed one.
- Development of procedures for correcting such errors and schedule redirection.
There are some really useful tools and techniques in order to develop the Schedule Control according to the steps mentioned before. Some of them are mentioned in Table 1.
| Tool or technique | Use |
|---|---|
| Trend analysis | Examines project performance over time to determine whether performance is improving or deteriorating. Graphical analysis techniques are valuable for understanding performance to date and for comparison to future performance goals in the form of completion dates. [1] |
| The Critical Path Method (CPM) | Comparing the progress along the critical path can help determine schedule status. The variance on the critical path will have a direct impact on the project end date. Evaluating the progress of activities on near critical paths can identify schedule risk. [1] |
| Critical Chain Project Management | Comparing the amount of buffer remaining to the amount of buffer needed to protect the delivery date can help determine schedule status. The difference between the buffer needed and the buffer remaining can determine whether corrective action is appropriate. [1] |
| Variance Analysis | Comparing planned activity start or finish dates against actual start or finish dates to identify variances between the schedule baseline and actual project performance. Further analysis can be performed to determine the cause and degree of variance relative to the schedule baseline and any corrective or preventative actions needed. [1] |
| Project Management Software | Project management software for scheduling provides the ability to track planned dates versus actual dates, to report variances to and progress made against the schedule baseline, and to forecast the effects of changes to the project schedule model. [1] |
| Resource Optimization Techniques | Involve the scheduling of activities and the resources required by those activities while taking into consideration both the resource availability and the project time. [1] |
| Modeling Techniques | Are used to review various scenarios guided by risk monitoring to bring the schedule model into alignment with the project management plan and approved baseline. [1] |
| Leads and Lags | Adjusting leads and lags is applied during network analysis to find ways to bring project activities that are behind into alignment with the plan. [1] |
| Schedule Compression | Are used to find ways to bring project activities that are behind into alignment with the plan by fast tracking or crashing schedule for the remaining work. [1] |
| Scheduling Tool | Schedule data is updated and compiled into the schedule model to reflect actual progress of the project and remaining work to be completed. The scheduling tool and the supporting schedule data are used in conjunction with manual methods or other project management software to perform schedule network analysis to generate an updated project schedule. [1] |
When is it applicable?
Schedule Control is most applicable when the project has to meet with a delivery date and this actually characterizes the majority of the projects. Waiting until the last moment to realise that your project won’t be delivered on time is not only unacceptable, but also offers little time to react and recover [5]. However, completing a project on schedule is important not only in terms of time but also economically. Reducing the duration of a project can impact the overall costs in terms of less salary payments, interests on loans or preventing loss of profit. For example, if a project consists on developing a new toy before Christmas and it finishes in February, all the profits of the Christmas campaign will be lost.
Cost Control
Cost Control is known as the process of monitoring the status of the project to update the project costs and managing changes to the cost baseline[1]. This technique also helps to understand how the project is progressing and to minimize risks.
A Cost Control system should follow the next steps [1][3]:
- Distribution of the budget through the different tasks of the project and creation of a cost baseline, which will be the planned budget accumulated over time. The data can be based on historical results or theoretical cost performance. The estimated budget it is also deconstructed into a Cost Breakdown Structure (CBS) to determine the budget for entire categories of work as well as detailed tasks.
- Monitoring the ongoing project activities.
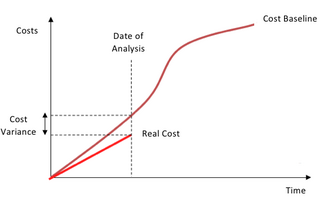
- Comparison of the planned and actual performance (Figure 2).
- Calculation of the variances and investigation of the reasons of those which are unfavorable.
- Analysis and implementation of corrective measures.
When is it applicable?
First of all, it could be said that Cost Control is applicable in all projects due to its importance in reducing risks and overcosts, specially in those which have a fixed price. Performing a cost control is really useful in the both opposite situations that can occur: negative trends, where actual costs are higher than the planned ones; and positive trends, which indicates that the work is progressing at less cost than it was expected. In the first situation, corrective measures implemented in short periods of time can reduce or end the negative case. In the second situation, the project manager can decide if it is possible to move resources to another task in order to improve its performance.[6]
Secondly, Cost Control is also very important in those projects where the Quality Control is essential. This is because in those type of projects, the client usually verifies that the performance meets with the specifications before authorizing payments. Therefore, Cost Control will be strongly influenced by the delivery quality.
Finally, the knowledge gained from this control also allows to make better estimations for future projects.
Integrated Cost and Schedule Control (EVM technique)
Once both Schedule and Cost Control have been shortly described, it is time to explain the combination of both, which is what actually allows the project manager the range of control needed to manage the work. [7] Before the method is explained, it is necessary to understand the meaning of the next terms.
- Performance Measurement Baseline: Time and cost parameters that the project team sets as the metrics to measure performance. The Performance Measurement Baseline (PMB) is the way the project would perform if it followed the planned schedule and planned budget exactly. The monitoring process begins only after the PMB has been established and agreed upon by the stakeholders. [8]
- Project Performance Measurement: The gathering of information that will be used during the analysis portion of the control process, … ,includes data on the cost of materials, labor, and equipment for work that has been performed. It includes the individual productivities for the crew that performed the work and the duration of the task. This aspect of project control provides an integrated snapshot of both time and cost as of a specific date called the reporting date. [8]
- Variations: Deviations from the planned performance. [8]
But just comparing the Project Performance Measurement with the Performance Measurement Baseline can’t tell you whether you’re on, under, or over budget. And here is where EVM comes in, which is the tool that is going to be explained regarding Integrated Cost and Schedule Control.
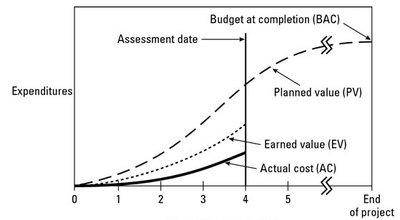
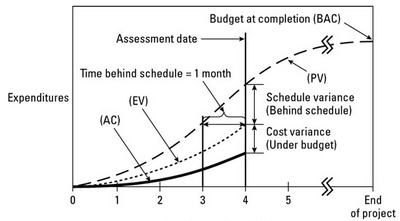
The basic parameters to be evaluated and compared in this method are the ones described in Table 2 and illustrated in Figure 3.
| Planned Value (PV) | The approved budget for the work scheduled to be completed by a specified date; also referred to as the Budgeted Cost of Work Scheduled (BCWS). The total PV of a task is equal to the task’s Budget At Completion (BAC) — the total amount budgeted for the task.[9] |
|---|---|
| Earned Value (EV) | The approved budget for the work actually completed by the specified date; also referred to as the Budgeted Cost of Work Performed (BCWP).[9] |
| Actual Cost (AC) | The costs actually incurred for the work completed by the specified date; also referred to as the Actual Cost of Work Performed (ACWP).[9] |
Once the data concerning this three parameters has been collected, the project’s schedule and cost performance can be measured by using the following indicators and indexes (Table 3).
| Schedule Variance (SV) | The difference between the amounts budgeted for the work you actually did and for the work you planned to do. The SV shows whether and by how much your work is ahead of or behind your approved schedule.[9] | 
|
|---|---|---|
| Cost Variance (CV) | The difference between the amount budgeted and the amount actually spent for the work performed. The CV shows whether and by how much you’re under or over your approved budget.[9] | 
|
| Schedule Performance Index (SPI) | The ratio of the approved budget for the work performed to the approved budget for the work planned. The SPI reflects the relative amount the project is ahead of or behind schedule, sometimes referred to as the project’s schedule efficiency. You can use the SPI to date to project the schedule performance for the remainder of the task.[9] | 
|
| Cost Performance Index (CPI) | The ratio of the approved budget for work performed to what you actually spent for the work. The CPI reflects the relative value of work done compared to the amount paid for it, sometimes referred to as the project’s cost efficiency. You can use the CPI to date to project the cost performance for the remainder of the task.[9] | 
|
To graphically see these indicators and to know how the project is in terms of advance or delay, Figure 4 is really useful. To measure if the project is behind schedule or not, you must draw an horizontal line from the intersection of the EV and assessment date to the PV line, as it is showed in the figure. At the end of the project, SPI will always be 1 since when all the work is completed, PV and EV are equal.
The project management or the control team have to pay special attention at the CPI index because once is below 1 (the project is over cost), it is really difficult to recover.
Finally, to update what the expected total costs will be at the end of the project there are two more indicators and one index:
- Estimate at completion (EAC): Your estimate today of the total cost of the task.[9]
- Assuming that the cost performance from that moment will be as it was originally budgeted:
- Assuming that the cost performance from that moment will be the same as for the work done to that date:
-
 (being optimistic)
-
 (being pessimistic)
-
- Estimate to complete (ETC): Your estimate of the amount of funds required to complete all work still remaining to be done on the task.[9]
- To-complete performance index (TCPI): Provides a projection of the anticipated performance or cost efficiency required to achieve either the BAC or the EAC.
-
 (For the TCPI based on BAC)
-
-
 (For the TCPI based on EAC)
-
When is it applicable?
Combining costs with schedule is necessary to have a whole overview of the current status of the project. But this is not the only application. Moreover, the project manager can use the integrated information to predict future performance in terms of schedule as well as for cash flow management.[7] The results obtained with 20 % of the project carried out show trends that are usually held until the end. In that moment, the additional cost and the percentage of overrun will be less than the one obtained at the end of the project. Moreover, the final cost can also be predicted with only 10% of deviation. This is why a great application of this method is to determine when the 20% of the work is done, if the project is likely to end successfully in terms of schedule and cost, or not.[10]
Example
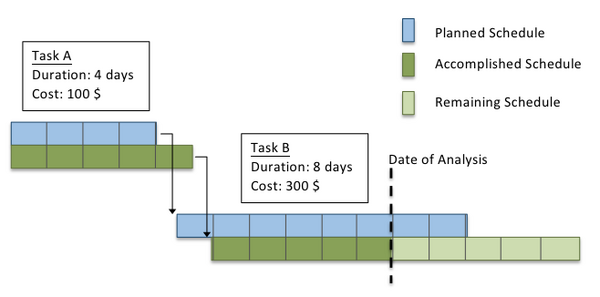
Figure 5 presents an example situation in which a project with only two tasks, A and B, is described in terms of cost and schedule. The objectives of this example are to illustrate how the EVM basic parameters are calculated and to show that by just comparing planned and performance data, one can reach wrong conclusions. With a quick view over the diagram in Figure 5 and the data collected at the day of analysis (Figure 6), the previous thoughts can be that task A has been delayed and over cost, and task B is also delayed but below cost. However, if we analyse the EVM parameters (Figure 7) we can see that due to the delays in the project, task B is actually over cost, what really affects the overall costs of the project. Therefore, the previous conclusion was incorrect. This exemplifies how useful the EVM technique can be and the importance of performing an Integrated Cost and Schedule Control.
Drawbacks and Limitations
It is very important that the data concerning how cost and schedule are developing is as precise and consistent with reality as possible. On the one hand, regarding the control of the progress of a project, it is very important that the capture of the state of a task is part of the work that has to be developed in each of the Work Packages. In other words, the workers should understand that the process control is one of their obligations and that they should provide feedback of the deviations that they detect as quick as possible. On the other hand, the control should be done over how the work is going on and not over how the employees are working. With this two indications concerning the human resources, the results of the control would be more objective and reliable. If the previous is not happening, the whole control process will be based on inaccurate data.
Another important limitation of the Integrated Cost and Schedule Control is that it doesn't include Quality Control processes. Therefore, even when the project ends on time and within budget, the result can be poor. In order to ensure the project management success, the three attributes of the Project Management Triangle must be fulfilled. Consequently, in addition to Integrated Cost and Schedule Control, Quality Control has to be done.
Moreover, Integrated Cost and Schedule Control and specifically EVM, must not be used alone. This is because even when it provides information on cost and schedule performance, they don't reveal why a project might be experiencing schedule or cost variances. [11]
Other drawbacks of employing this technique is the cost of implementation, training, and software. This costs maybe prevent small organization or those who don't have a solid project management system from using this types of control. [11]
References
- ↑ 1.00 1.01 1.02 1.03 1.04 1.05 1.06 1.07 1.08 1.09 1.10 1.11 1.12 1.13 1.14 1.15 1.16 1.17 PMI. (2013). "A Guide to the Project Management Body of Knowledge (PMBOK® Guide)", Fifth Edition. This is the preeminent global standard for project management. It provides project managers with the fundamental practices needed to achieve organizational results and excellence in the practice of project management.
- ↑ Ferguson, J. and Kissler, K. (2002). Earned Value Management. [online] CERN Document Server. This paper explains how CERN has implemented the EVM in their projects and gives a short introduction and description of the method
- ↑ 3.0 3.1 3.2 Barron. (1994). “Integrated cost and schedule control”, 3/1–3/3. This paper outlines a recommended process for establishing and maintaining cost and schedule control of a project through the use of an earned value based performance measurement system.
- ↑ 4.0 4.1 Del Pico, W. J. (2013) The Basics, in Project Control: Integrating Cost and Schedule in Construction, John Wiley & Sons, Inc., Hoboken, NJ, USA. doi: 10.1002/9781118802717.ch1. This chapter provides an overview of project management theory and where project control fits into the discipline. It does not offer detailed instruction in the profession of day‐to‐day project management, but will review the theory of project management and the basic concepts common to the construction industry.
- ↑ Del Pico, W. J. (2013) The Schedule, in Project Control: Integrating Cost and Schedule in Construction, John Wiley & Sons, Inc., Hoboken, NJ, USA. doi: 10.1002/9781118802717.ch4. This chapter reviews scheduling in general and the Critical Path Method (CPM) of scheduling in particular. It is not meant to be a detailed explanation of CPM, but merely a refresher, focusing on how the schedule is used in project control.
- ↑ Del Pico, W. J. (2013) The Budget, in Project Control: Integrating Cost and Schedule in Construction, John Wiley & Sons, Inc., Hoboken, NJ, USA. doi: 10.1002/9781118802717.ch5. This chapter reviews the estimating process and its contribution to project control.
- ↑ 7.0 7.1 Del Pico, W. J. (2013) Integrating the Schedule and the Budget, in Project Control: Integrating Cost and Schedule in Construction, John Wiley & Sons, Inc., Hoboken, NJ, USA. doi: 10.1002/9781118802717.ch6. This chapter studies the integration of the schedule and the budget for the full impact of project control. It is the combination of both schedule and budget that allows the project manager the range of control needed to manage the work.
- ↑ 8.0 8.1 8.2 Del Pico, W. J. (2013) Introduction to Project Control, in Project Control: Integrating Cost and Schedule in Construction, John Wiley & Sons, Inc., Hoboken, NJ, USA. doi: 10.1002/9781118802717.ch2. The concept of project control is here introduced as an essential aspect of the project management process.
- ↑ 9.00 9.01 9.02 9.03 9.04 9.05 9.06 9.07 9.08 9.09 9.10 Managers, E. (2015). Earned Value Management Terms and Formulas for Project Managers - For Dummies. [online] Dummies.com. Available at: http://www.dummies.com/how-to/content/earned-value-management-terms-and-formulas-for-pro.html [Accessed 20 Sep. 2015]. This page explains the basic parameters, indicators and indexes of the EVM and how are calculated.
- ↑ Fleming, Quentin W. & Koppelman, Joel M. (2000) Earned Value Project Management, PMI, Second Edition. This book describes earned value project management in its most fundamental form, for application to all projects, of any size or complexity.
- ↑ 11.0 11.1 Neagu, C., (2014) Earned Value Management—An “Overhead” View (PART 2: EVM Drawbacks and Benefits). [online] rationalplan.com. Available at: http://www.rationalplan.com/projectmanagementblog/earned-value-management-an-overhead-view-part-2-evm-drawbacks-and-benefits/ [Accessed 20 Sep. 2015]. This article shortly describes some Drawbacks or Limitations, Benefits and Applications of EVM.
