Root Cause Analysis
Developed by William Vossgård
Abstract
Root Cause Analysis (RCA) is a method of problem solving that can be used in a project, program or portfolio (PPP) to identify root causes of faults and problems in order to identify appropriate solutions. It is broadly used in several industries, among the health care, infrastructure and information technology industry. A Root Cause Analysis supposes that it is more effective to go in-depth of occurring problems, so that the underlaying issue can be treated, instead of only treating ad hoc symptoms. Root Cause Analyses can be performed with several different methodologies, principles and techniques together to identify the root causes of a defect or problem. The goal is to find out where processes or systems failed or caused an issue in the first place. In this article, the most common and broadly used techniques will be covered.
Contents |
Introduction
To be able to fully understand what a root cause analysis is and what it is used for, it is easier to relate it to something we are entirely acknowledged with. If your arm hurts considerably after an accident, you will go to the doctor to find the root cause of your pain. Also, if your computer stops working, you will try to find the root cause of its malfunction, either by yourself or by a professional technician. For these examples, a simple remedy could be found for the symptoms. To stop your arm from hurting, you could put ice on it to relive pain. To get work done with a broken computer, you could use your phone or tablet instead. Unfortunately, this would only consider the symptoms and not the underlaying issue that caused the problem. The injured arm may need surgery to entirely recover from the sustained injury, and the broken computer may need to have a new battery to function again. The best way to solve a fault or problem would therefore be to perform a Root Cause Analysis. By doing this, the exact root cause can be found so that the correct management of the fault or problem will be accomplished. There are a number of techniques and strategies that can be used for root cause analyses. In this article, the most commonly and widely used techniques will be covered.
Conducting a root cause analysis
There is not one specific way of performing a root cause analysis as there are many different techniques and strategies that can be used. In this chapter, the most common and broadly used techniques will be covered. Root cause analyses gives the best effect when a team is gathered, to do the analysis together. In particular, it should be done with those employees, who are directly involved in the problem-causing processes.
Goals and benefits
Related to the root cause analysis, there are three goals that should be realised. The first one being to discover the root cause of a failure or problem. The second is to develop an understanding on how to fix and learn from the underlaying issues relating the root cause. The third and final is to apply the findings from the root cause analysis, to systematically prevent future issues or problems. The third goal is especially important as this is what gives the analysis a reason to be performed. Root cause analysis can be used for increasing the productiveness in several core processes as well, with the goal to prevent problems in the future. Instead of replacing punctured bike tires on rental bikes, puncture proof tires could be installed instead if the problem persists [1].
General principles
To achieve an effective root cause analysis process, there are some general principles that should be taken into consideration. These principles will increase the quality of the analysis and will help the analysis get trust from clients and stakeholders [2].
- Root cause analyses gives the best effect when a team is gathered, to do the analysis together. In particular, it should be done with those employees, who are directly involved in the problem-causing processes.
- Consider to actually correct and remedy the root causes, not only the symptoms.
- While performing the root cause analysis, also remember to treat symptoms for short term fixing.
- Avoid focus on who was responsible of the failure or problem, instead focus on how and why.
- Find and document ways to prevent similar root causes in the future.
- When finding root causes, provide cause-effect evidence to back it up.
- Often there are multiple root causes, therefore search for several.
As it can be understood from the principles above, it is important to take a comprehensive and holistic approach in this type of analysis. As the root causes have no importance if no action is taken afterwards, it should be strived to provide information and context that can solve the failure or problem.
Fishbone Diagram
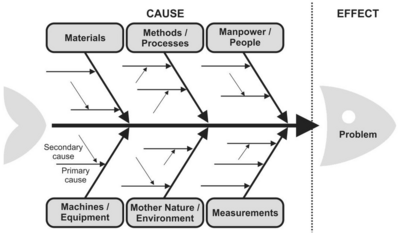
A Fishbone diagram, which also is called an Ishikawa diagram, is used to identify root causes of quality problems. The fishbone diagram provides an organised way of looking at effects and causes. It can also be referred to as a cause-and-effect diagram. It generally represents a model of indicative presentation for the correlations between an event, which is an effect, and its several causes. This helps the team members get the same understanding of the problem, so that they can think systematically. The root causes of a problem can by using this structured approach be found, while encouraging group participation, utilising group knowledge and identifying areas where data should be collected for future studies. Hence the name, the diagram has the same structure as the skeleton of a fish. While it most often is used in a simple representation, with segments leaning on a horizontal axis, it can also be done with a more extensive approach. An example of this is by naming and coding of the risks which characterises the causes and sub-causes. This consists of elements that show the causes and sub-causes succession with different ways for risk treatment [3].
Five steps should be followed to successful use the Fishbone diagram technique [4]:
- The first step is to state the problem precisely. This problem statement must be carefully chosen, and it is important that it is specific enough.
- Define the main influencing factors. This is the factors are put in the horizontal category segments in the fishbone diagram. Different defects or problems have different influencing, which means that these should be chosen after what is relevant. Examples of these is seen in the figure 1.
- State the causes into the diagram sorted after the different categories. This should be done with those employees that are directly involved in the problem causing processes. Also, the team should consist of a mix of different levels of expertise. When analysing the problem statement and finding causes, further sub-causes can be elaborated upon.
- Prioritise the causes. In the same team, make each person state their opinion as what is the most serious cause of the defect or problem. After a discussion about the causes, each person can give points to the causes that they believe are the most serious. The causes with the most points, should then be prioritised.
- Take measures. Tackle the defect or problem by eradicating the cause or causes. I it’s important that it is certain that the correct cause have been identified. To make sure of this, a significance test can be used for verifying, in order to select suitable methods for problem-solving.
The 5 Whys
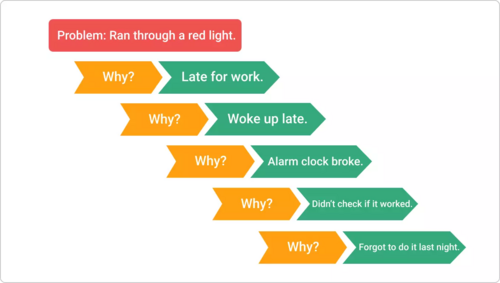
The 5 whys is a simple, yet powerful way of finding root causes. It works as an iterative interrogative technique to explore cause-and-effect relationship underlaying a particular problem. It is often used together with the a Fishbone diagram to find the root causes for the causes on the diagram. As the name of technique implies, the primary goal is to find the root cause of a problem by asking “Why?” five times. Each answer of the “Whys” forms the basis for the next question, and when the fifth “Why?” have been answered, the root cause should be found. Five times is generally enough, but if the root cause still not is found, it could be repeated up to a total of six, seven or higher levels. For problems or defects that do not have one single root cause, the technique must be repeated asking a different sequence of questions each time [5].

The five steps to conduct the 5 whys analysis, is to [6]:
- Gather a team who can develop a problem statement in agreement. At this point, it should be discussed whether additionally individuals are needed to resolve the problem.
- Make the team come with statements on “Why is this or that defect or problem taking place?”. This is the first “why” of the analysis. There are most probable multiple statements for this, and they should all be written down.
- Repeat the same process asking “why” four more times. This should be done for every statement from the first “why” in the structure like figure 2 shows. All plausible answers should be written down. When the “why” does not yield further useful information, you have found the root cause. This means that is sometimes may take more than five layers to find the root cause.
- Among the many answers to the last asked “why”, look for systematic causes of the defect or problem. This should be discussed in the group to be able to settle for the most likely systematic cause. The product from the team session should then be showed to others to confirm that they see the same logic in the analysis.
- The last and final step of the 5 why analysis is to develop appropriate corrective actions to remove the root cause from the system. Others can undertake these actions but planning and implementation will benefit from inputs from the team.
Pareto Chart Analysis
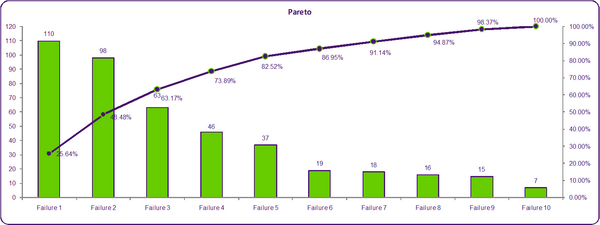
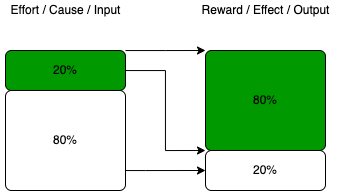
The Pareto chart combines a histogram (bar chart) and a line chart, where cost or frequency of defects or problems show their relative importance. Frequencies are shown in the histogram with descending order of the bars, and the line chart shows the totals or the cumulative percentages increasing from left to right. It is based on the Pareto principle, which states that “80% of the effects or consequences come from 20% of the causes”. This is not like the immutable laws of physics but based on continuous observations. On those observations, it has showed to be applicable to many aspects of life and natural phenomena. In relation to a root cause analysis, the Pareto Chart Analysis helps identify the top 20% of the causes that needs to be addressed to resolve 80% of the problems [7].
In order to perform a Pareto Chart Analysis, the following needs to be done [7]:
- Gather and collect data on the frequency of the causes of a defect or problem.
- Sort the causes after most to least important, and then calculate the cumulative percentage.
- Plot bars of the causes ordered from most to least frequent on the x-axis, and then plot the cumulative percentages on the y-axis.
- Finally, separate the 20% most important root causes from the rest by lifting the x-axis to the 80% cumulative percent on the y-axis.

Challenges and limitations
For the Root Cause Analysis to give results, it is dependent on a larger problem-solving effort to improve the quality in a business. It therefore the managements responsibility to make the best use of the findings from the root cause analyses. The root cause analysis on itself would not provide the correct result. When it comes to the conduction of a root cause analysis, it is hard to fully know if you have taken every root cause into consideration. The reason for this is because there can be multiple root causes, and there is hard to tell when every root cause has been found. This can lead to too much time spent on irrelevant underlaying factors, which result in confusion and a waste of time. The 5 whys and the fishbone analysis does not rely on specific data, which can lead to less reliable results. The management can therefore have trouble entirely trusting these analyses.
Annotated Bibliography
The 5 whys by Olivier Serrat The article “The Five Whys Technique” by Olivier Serrat, provides powerful knowledge within the use of the five “why” technique. It provides sufficient information both in relation to the background and meaning of using this technique, but also a step by step guide on how to use it in practice. This is very useful both for current and upcoming managers who will stumble upon a need to use this technique in real life. The article is short, which makes it quick to read. But if there is a need for further knowledge within the subject, reading material of high quality is referred to at the end of the article.
Root Cause Analysis: The Core of Problem Solving and Corrective Action by Duke Okes In the book Root Cause Analysis: The Core of Problem Solving and Corrective Action, the author Duke Okes goes in-depth of the importance of using and how to use root cause analyses to catch the actual root causes of problems, and not only the symptoms of them. Different techniques to be implemented into a business are presented in detail so that the management in a company can reduce the amount of reoccurring problems. The terminology in this book is also simpler than most articles and research books, which makes it easy to read for the management.
The Importance of Root Cause Analysis During Incident Investigation by the Occupational Safety and Health Administration (OSHA) The factsheet supplied by the OSHA provides a hands-on guidance for conducting root cause analyses in general. Different from most other articles this factsheet provides clear instructions for the whole root cause analysis process, both on a low level where problems are easy to find the causes for, but also for more complex problems. This gives the employees a good understanding of when to actually contact the upper management, which is very useful to achieve optimal efficiency in a company.
References
[1] Root Cause Analysis Explained: Definition, Examples, and Methods by Tableau
[2] Basic Principle of Root cause analysis by GeeksforGeeks
[3] Application Of Fishbone Diagram To Determine The Risk Of An Event With Multiple Causes by the UTI Grup SRL and the Academy of Economic Studies
[4] Fishbone diagram: Solving problems properly by IONOS
[5] 5 Whys Method by CORSHIP – CORPORATE EDUPRENEURSHIP
[6] The Five Whys Technique by Olivier Serrat
[7]Pareto Analysis by Dr. Himanshu Hora, SRMS College of Engineering & Technology Bareilly

