Project Management tool: Gantt Chart
This article is related to Advanced Engineering Project, Program and Portfolio Management course. The aim of the article is the description of the Gantt chart as a tool for Project management, the method, applications, advantages and limitations will be explain.
Contents |
Big idea
History

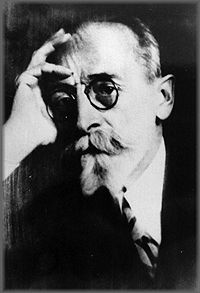
Karol Adamiecki devised the first ‘Gantt’ chart, back in 1896. He was a Polish engineer turned management professor who came up with the idea of displaying processes visually so that he could make it easier to see production schedules – he did most of his work in the steel industry. He called it the harmonogram but he published his articles on it in Polish and Russian, so the English-speaking world didn’t know much about it.
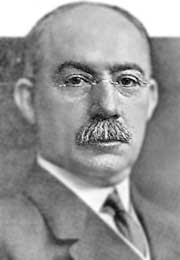
Henry Gantt had the same idea, but about 15 years later. In 1910 Gantt started planning visually with bar charts to allow supervisors in the steel works to see if production was on track or behind schedule. It was Gantt’s name that got attached to this way of planning, but today it’s generally recognized that Adamiecki had the idea first.[1]
Concept
To complete a project successfully, you must control a large number of activities, and ensure that they're completed on schedule. If you miss a deadline or finish a task out of sequence, there could be knock-on effects on the rest of the project. It could deliver late as a result, and cost a lot more. That's why it's helpful to be able to see everything that needs to be done, and know, at a glance, when each activity needs to be completed.[2]
Gantt charts convey this information visually. They outline all of the tasks involved in a project, and their order, shown against a timescale. This gives you an instant overview of a project, its associated tasks, and when these need to be finished.[2]
State of the art
Originally Gantt charts were prepared laboriously by hand; each time a project changed it was necessary to amend or redraw the chart and this limited their usefulness, continual change being a feature of most projects. Nowadays, however, with the advent of computers and project management software, Gantt charts can be created, updated and printed easily.
Today, Gantt charts are most commonly used for tracking project schedules. For this it is useful to be able to show additional information about the various tasks or phases of the project, for example how the tasks relate to each other, how far each task has progressed, what resources are being used for each task and so on. [3]
How to create a Gantt Chart
Step 1: Identify Essential Tasks
Gantt charts don't give useful information unless they include all of the activities needed for a project or project phase to be completed.
List all of these activities. Use a work breakdown structure if you need to establish what the tasks are. Then, for each task, note its earliest start date and its estimated duration . [2]
- Planned start date: This is the date that you aim to start working on the task.
- Estimated duration: This is a single number that reflects how many days there are between the planned start date and the planned finish date. It’s based on working days, so if a task is planned to take a week it will reflect 5 (working) days.[1]
Step 2: Identify Task Relationships
The chart show the relationship between the tasks in a project. Some tasks will need to be completed before you can start the next one, and others can't end until preceding ones have ended. For example, if you're creating a brochure, you need to finish the design before you can send it to print.
These dependent activities are called "sequential" or "linear" tasks. Other tasks will be "parallel" – i.e. they can be done at the same time as other tasks. You don't have to do these in sequence, but you may sometimes need other tasks to be finished first. So, for example, the design of your brochure could begin before the text has been edited (although you won't be able to finalize the design until the text is perfect.)
Identify which of your project's tasks are parallel, and which are sequential. Where tasks are dependent on others, note down the relationship between them. This will give you a deeper understanding of how to organize your project, and it will help when you start scheduling activities on the chart.[2]
Step 3: Input Activities Into Software or a Template
You can draw your charts by hand or use specialist software, such as Gantto, Matchware, or Microsoft Project. Some of these tools are cloud-based, meaning that you and your team can access the document simultaneously, from any location. (This helps a lot when you're discussing, optimizing, and reporting on a project.)
Several Gantt templates have been created for Microsoft Excel, and you can also find free templates with a quick search online.[2]
Step 4: Chart Progress
As your project moves along, it will evolve. For example, in our scenario, if quality assurance of core modules revealed a problem, then you may need to delay training, and halt development of the management information system until the issue is resolved.
Update your chart to reflect changes as soon as they occur. This will help you to keep your plans, your team, and your sponsors up to date.[2]
Application
In order to succeed with the application of this method the following aspect have to be consider by the project manager
Dependencies
Task dependencies are the links between project activities. Understanding how tasks link to and rely on each other lets you create a project schedule so that everything happens in the right order.
There are four types of task dependency:
Start-to-start: Both tasks start at the same time, or one task has to start before the other can start. For example, if you were building a shopping website you can start writing the code for taking payment and the code for finding the nearest outlet at the same time (assuming you had enough developers and the two pieces of code didn’t have any overlaps).
Finish-to-finish: Let’s assume you’re working in an Agile environment where you’re testing and tweaking that shopping website until it exactly meets your requirements. Instead of having Test-Update Code-Test-Update Code-Test-Update Code-Test ad nauseum on your plan, you can have Test and Update Code with a finish-to-finish dependency where updating the code finishes at about the same time or before testing.
Finish-to-start: One task ends before the other task begins. This is the most common type of dependency and creates sequential tasks. On your shopping website, you have to finish the testing before you can demo the solution to the Marketing team. There is a finish-to-start relationship between testing and doing the demo.
Start-to-finish: One task starts before another task finishes. This is the least common type, and you have to look hard to find examples you could use in real life. Here’s one: your team is working in shifts to develop code for your shopping website. Fred’s shift is due to finish but he has to brief Mason about the bug he’s found before he can leave. Mason is held up in traffic. The start of Mason’s shift controls the finish of Fred’s shift. You can see from that how start-to-finish relationships work, but you’ll probably never use one on your schedule.

Getting the right work done at the right time is essential if you want to deliver your project successfully. Unfortunately, the links between tasks aren’t always clear, and you don’t always want to work on tasks one after the other. Dependencies enable you to work out the best order for your project tasks, giving you the fastest route through the project and getting everything done in a structured way.
The impact of getting a dependency wrong can be devastating for a project. If a task is scheduled to complete on a certain date, the resources who are next in line down the chain will be waiting to take over. If the task doesn’t complete as scheduled, they might not be able to pick up any other work so they are either sitting around costing you money but doing nothing, or their manager will pull them off the project and you’ll have to wait until someone else with similar skills is available.
If a task finishes early, you think you can save time and tell the stakeholders that you are ahead of plan. But the owners of the next task in line might not be ready to do their step. They have to finish their last activity before they start the next one, so no time is saved after all. If two tasks are scheduled to start at the same time and one isn’t ready, the other one will also be delayed.
Whatever the reason, the outcome is nearly always the same: your project gets delayed. That’s why it’s important to monitor dependencies regularly and communicate effectively between the team so that everyone knows when to expect work to be coming their way. [4]
Lag time
Critical path
Float
Risk Mitigation
Advantages


The application of a Gantt Chart in a project allows to:
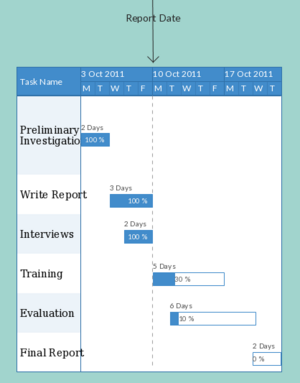
Avoid Completion Confusion: By providing a visual overview of milestones and other key dates, these charts are thought to offer a more understandable and memorable method of maintaining timescale-based tasks and deliverables whether tracked on a daily, weekly, monthly or yearly basis. Figure 1 shows the power of visualization found in Gantt charts. In a glance you can see that the interviews are done, there 50% more to do in training etc.[5]
Keep Everyone on the Same Page: Where there is a visual framework for the work to be done, there are fewer chances for misunderstanding, especially when it comes to highly complex tasks. Using Gantt charts allow all types of stakeholders to have the same information, set mutually understood expectations, and conduct their efforts according to the desired protocol.[5]
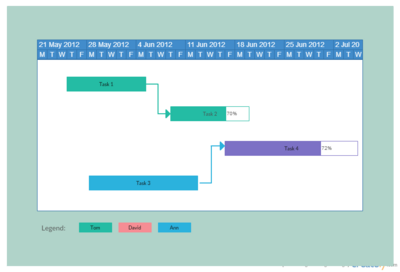
Understand Task Relationships: These charts can make clear how various tasks are interrelated and perhaps rely on the completion of another to meet specific objectives. These task relationships revolve around understanding the timing of each task, which then impacts other tasks listed(Figure 2). This can better assure the optimum work flow, maximized productivity and overall project success.[5]
Effectively Allocate Resources: By being able to look ahead on the Gantt chart, users can clearly discern where resources need to be anticipated, allocated or shared to maximize the use of those resources. The more closely the chart is followed, the better chance there is of keeping project costs within budget while also better assuring on-time completion.[5]
Get a Handle on the Future: While it is often easy to get caught up in day-to-day tasks as detailed on a chart, Gantt chart advantages include helping decision-makers look farther ahead to ensure each given project is working toward the achievement the organization’s long-term strategic objectives. [5]
Gantt charts are useful for monitoring a project's progress once it's underway, too. You can immediately see what should have been achieved by a certain date and, if the project is behind schedule, you can take action to bring it back on course
Gantt charts are useful for planning and scheduling projects. They help you assess how long a project should take, determine the resources needed, and plan the order in which you'll complete tasks. They're also helpful for managing the dependencies between tasks.
Limitations
Bibliography
For more information about how to manage task dependencies read: https://www.projectmanager.com/blog/manage-task-dependencies
References
- ↑ 1.0 1.1 Tell me about Henry Gantt - https://www.projectmanager.com/gantt-chart
- ↑ 2.0 2.1 2.2 2.3 2.4 2.5 https://www.mindtools.com/pages/article/newPPM_03.htm
- ↑ What is a Gantt Chart?- Gantt Chart History http://www.gantt.com/index.htm
- ↑ https://www.projectmanager.com/blog/manage-task-dependencies
- ↑ 5.0 5.1 5.2 5.3 5.4 http://creately.com/blog/diagrams/5-reasons-to-use-gantt-charts/
