Project Network Diagram
Contents |
Abstract
This article is an application oriented in-depth description of the Project Network Diagram tool (PND tool). Firstly, the article will explain and visualize the necessary processes one should work through, to arrive at the PND. These processes involve the Work Breakdown Structure (WBS) and a time-estimate on the different bodies of the WBS. After arriving at the PND, the article will explain how to find slack areas, so the project manager will get a clearer vision of how to prioritize resources for the project. Finally, it explains how the critical path of the project is deduced from the PND.
Pre-processes for the Project Network Diagram (PND)
In order to define the PND for a specific project, the project manager need inputs. These inputs are the Work Breakdown Structure (WBS) as well as a time estimation for the different bodies on the WBS.
Work Breakdown Structure (WBS)
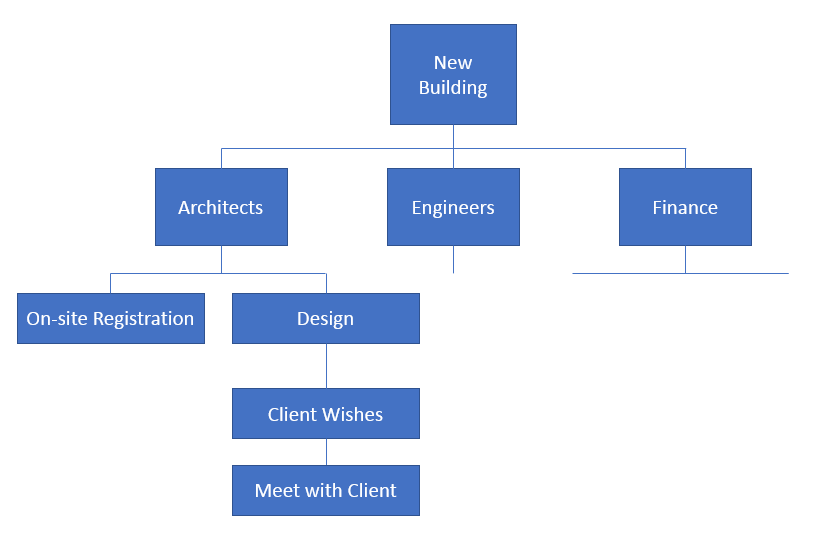
The WBS should be formulated in a top-down box order. That means, that the highest level of the WBS is the overall project. From there, the next level beneath confines deliverables in order to reach the project goal. These deliverables are confined in the second level boxes. Deliverables are things as they shall be defined by nouns and not verbs. Now to the third level, where all the deliverables can be broken into items. This procedure continues until one reaches the lowest level, being the action level, where direct actions in order to reach the level above is defined. [1] An example of such a WBS is given in Figure 1.
The WBS shown in the figure illustrates an example with a project, where a new building is to be built. Of course, for the sake of simplicity, the project components are confined to only a few, in comparrison to what a real such project would include as components.
It is seen that the overall goal is to build a new building. This is the project. The second level describes some areas of deliverables. The architects have deliverables for the project, and same goes for the Engineers and e.g. Finance (who is going to pay for the building, how should the contracts be defined etc.). To make the WBS foreseeable in this example, only the lower levels for the architect group are defined. One deliverable from the architects could be the entire design of the building. To make a design, the architects should know what their client wishes are, so they meet ends with regard to mutual satisfaction for the project stakeholders. The last level defined in the example is a level of action. This level is pretty intuitive, as it can be interpreted in the same way, that many people use post-it notes at work every day – it is simply things one needs to do, described in keywords.
Time estimation of the WBS
When having defined a functional and rational WBS, a time estimation of each component should be determined, in order to eventually estimate a project overall duration and critical path. The idea here is to formulate the time estimates as realistic as possible. For many projects, the primary key factors are time and economy. The more conservative time estimates will often be aligned with the more successful projects. [2] It is very different for individual projects, how time estimation is handled. For smaller firms, it is often the experienced senior managers that drives their estimates on heuristics. They apply their experience and realistic estimates to agree on a good time interval for processes in the project. Sometimes, the time estimates are based on a best case scenario, an average scenario and a worst case scenario, regarding the time needed for a process. This can lead to the usage of a Monte Carlo method, to estimate the probable time intervals. This is a widely used method when the data simulated has a large number of samples, or historical examples. [4] In all, time estimations can be built on a large variety of validating foundations, and by all means, the statistical method will always be the most meaningful with regard to realistic results, but the necessary amount of samples to complete it is not always at hand. Besides, completing a Monte Carlo simulation requires that the analyst has an insight in order to differentiate for correlation between key factors, why it can be a somewhat cumbersome process. [5]
Defining the Project Network Diagram
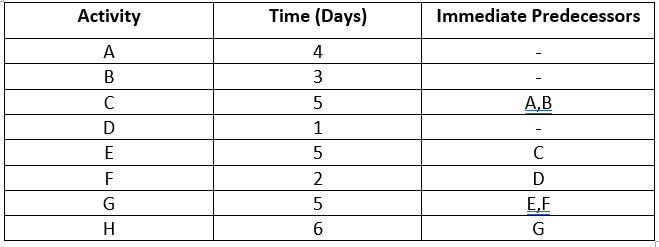
After the process of formulating a rational WBS, and good time estimates on the different bodies of the WBS, a Project Network Diagram can be constructed. The following will give an example of such a PND. [6] First off, see the table shown in Figure 2.
The table shows an example of how one can establish a WBS on table form. The activities are the different bodies of the WBS, and the time is estimated and allocated to each individual body/activity. The Immediate Predecessors is a list of dependencies. This is the new object to include. In Figure 2 it is shown as the last column, at an activity row. This means, that when coming to activity C, activity A and B must be completed beforehand. In other words, task C can start solely when A and B are done. Where the cells of Immediate Predecessors are empty, the connecting activity can be started whenever the project starts. They do not depend on other activities. In this example, the project manager could potentially start activity A, B and D at the same time, at the beginning of the project.
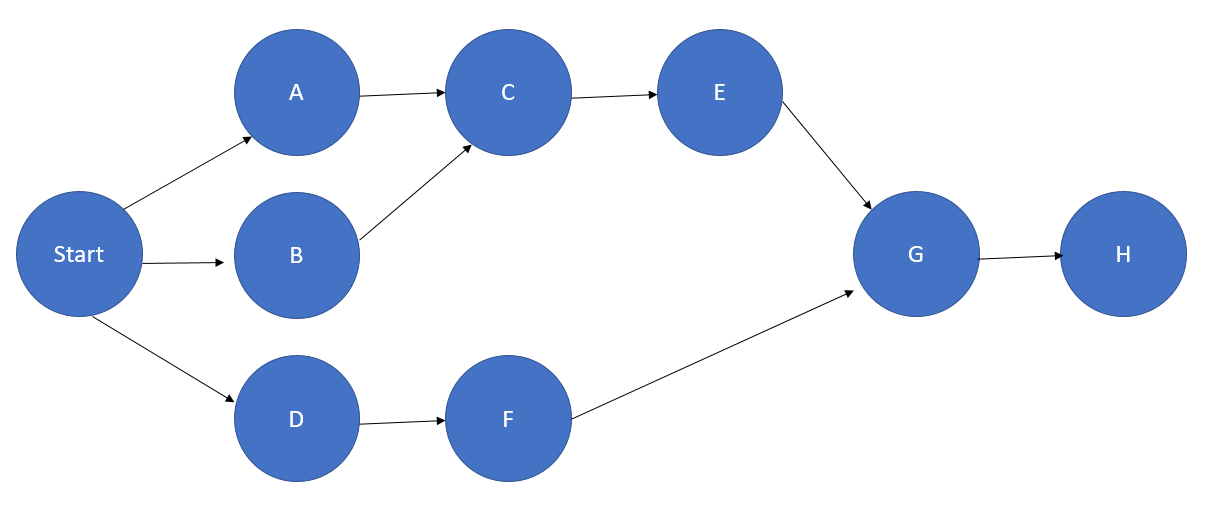
After having formulated this table with immediate predecessors, built upon the WBS and time estimation for each activity, the PND can finally be constructed. The project manager can do this by making a start point, and visualize the start off possibilities. An example of this is shown in Figure 3. and the explanation follows.
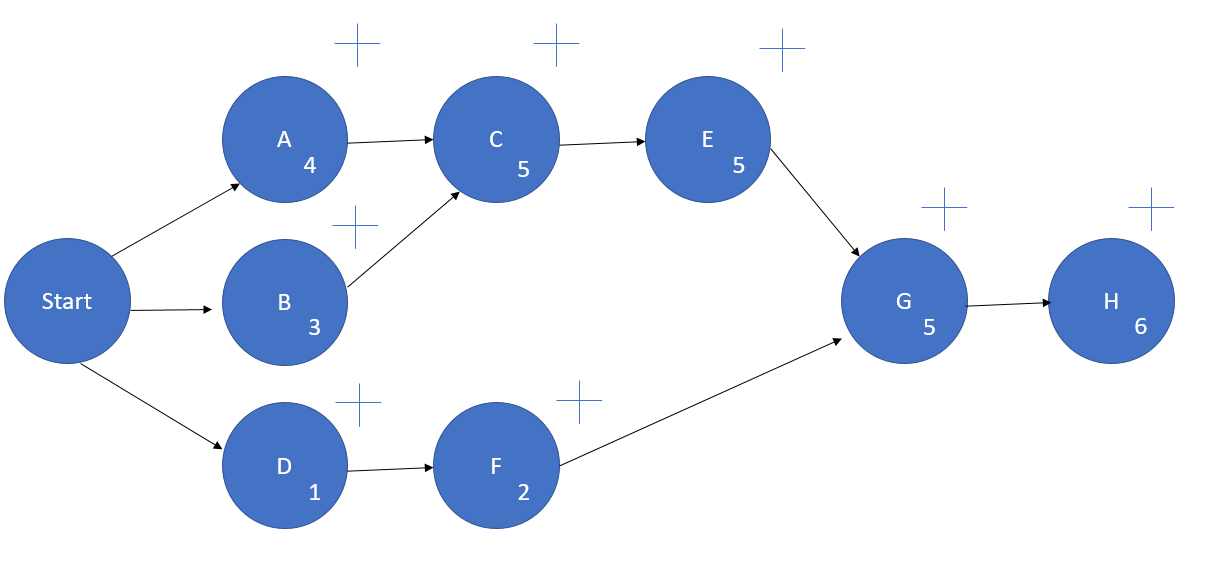
The arrows in the diagram shows the dependencies. For example, activity C depends both of activity A and B, why C is connected to these mentioned activities. Activity F depends only on activity D, why this activity is solely connected by D. This diagram now shows the flow of activities. Now, the time estimates of the different tasks should be implemented. This is done by inserting numbers in every circle, corresponding to the time the activity takes. This can be seen in Figure 4.
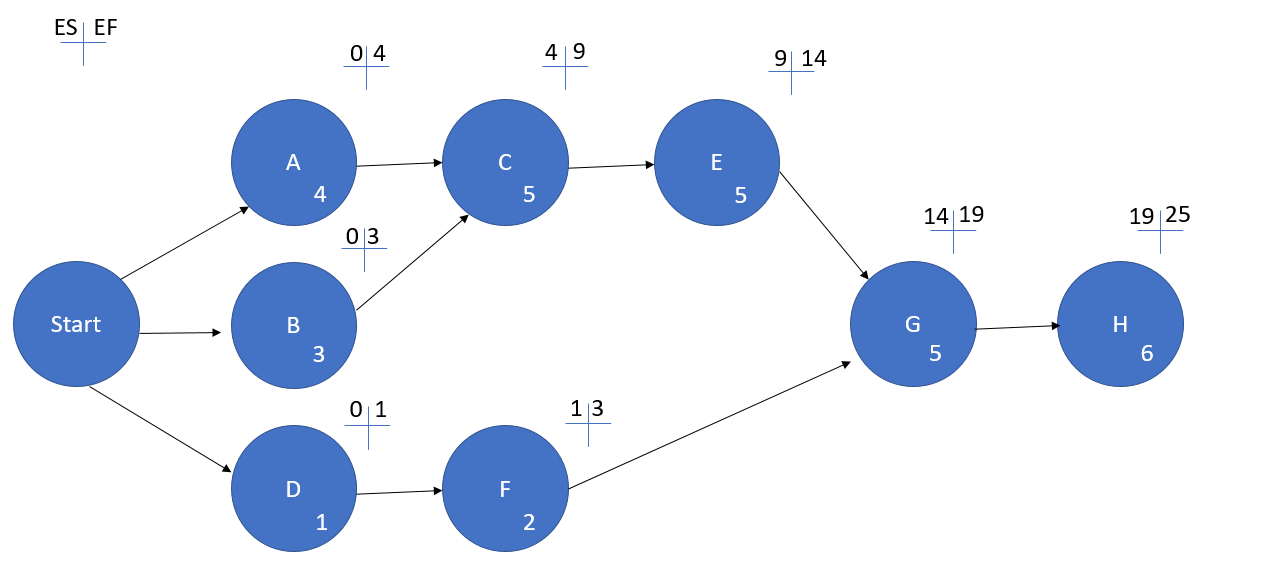
For example, it is seen that task C takes 5 days, why 5 is inserted into the C circle and so forth. The crosses that now show above all circles are for the further calculation of the overall duration and critical path. Now, numbers are to be filled into the crosses, and the way they should are as follows: Top left corner is ES, which stands for Earliest Start. This will indicate when is the earliest time the activity can start. Top right corner is called EF, which stands for Earliest Finnish. This is intuitively the time it would take to complete the task in the fastest scenario possible. Task A, B and D can all start at the beginning, why the number 0 is put into the place of ES. Then, the EF would be 4 days, 3 days and 1 day for A, B and D respectively. Then, if one looks at task C, the ES should be filled out. Now there are two tasks that are linked to task C (being task A and B). The ES will then be the highest value, of the EF for the previous tasks. Since A and B can be done simultaneously, the highest required number of days for the respective tasks will determine the value of the beginning time foor the next task. That means that task C can be completed after task A is finished, being the highest number of days, four days. Task C itself takes 5 days, so the earliest finnish time for task C will be the previous 4 days plus its own duration of 5 days, meaning 9 days in the time schedule. To visualize and comprehend the method, see figure 5
As it is seen, task G can again only start when the corresponding previous tasks are finished, which is determined by the longest task line, being the one including task E, which makes it 14 days until task G can begin. It is also seen, that the last task can begin the earliest after 19 days, and that it takes 6 days itself, why the overall earliest finish of the project will be 25 days.
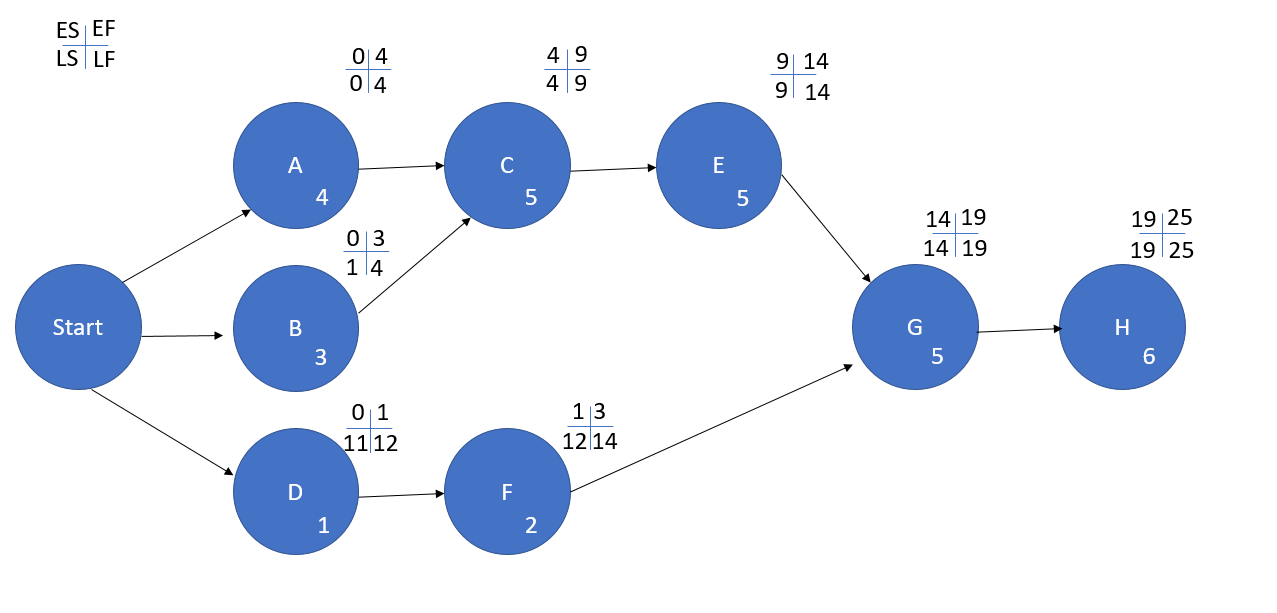
After having done this, the time has come to declare what the latest start (LS) is for each task. The LS value maintains, that the project will still finish in the firstly calculated overall duration (being 25 days). The LS value will be in the bottom left corner of the cross. To the bottom right, the latest finish (LF) time is introduced. Here, the question is when is the latest possible time the tasks can finish in order to maintain the overall duration. The trick to this is to go “backwards” in the PND. You start with the last task, being task H here, and fill out the LF in the bottom right corner. It is of course the 25 days that should be put in the LF for task H, since this is the latest finish we demanded for our project. In the LS field, the latest start should be the latest finish minus the duration of the task, meaning (25-6) days = 19 days. To see the principle, see Figure 6
Take task G for example, here the latest finish must match the earliest start for the next task (task H) why task G must finish latest at day 19. The duration of G is 5 days, so the latest start must be (19 – 5) days = 14 days. When there are 2 tasks connecting to a point, as in task E and F connecting to task G, the approach is to take the latest start of G, and find the latest start of either E or F by subtracting their individual duration from this mutual requirement. This means that task F must latest be finished at day 14, where task G has to start, but since F is only a 2 day task, it can start at day (14-2) days = day 12. Another example is for task A, where the latest start for task C is 4 days, so the latest finish for task A is 4 days. Then, since A takes 4 days, it must start at day 0 (LS = 0) in order to finish on time.
Slack
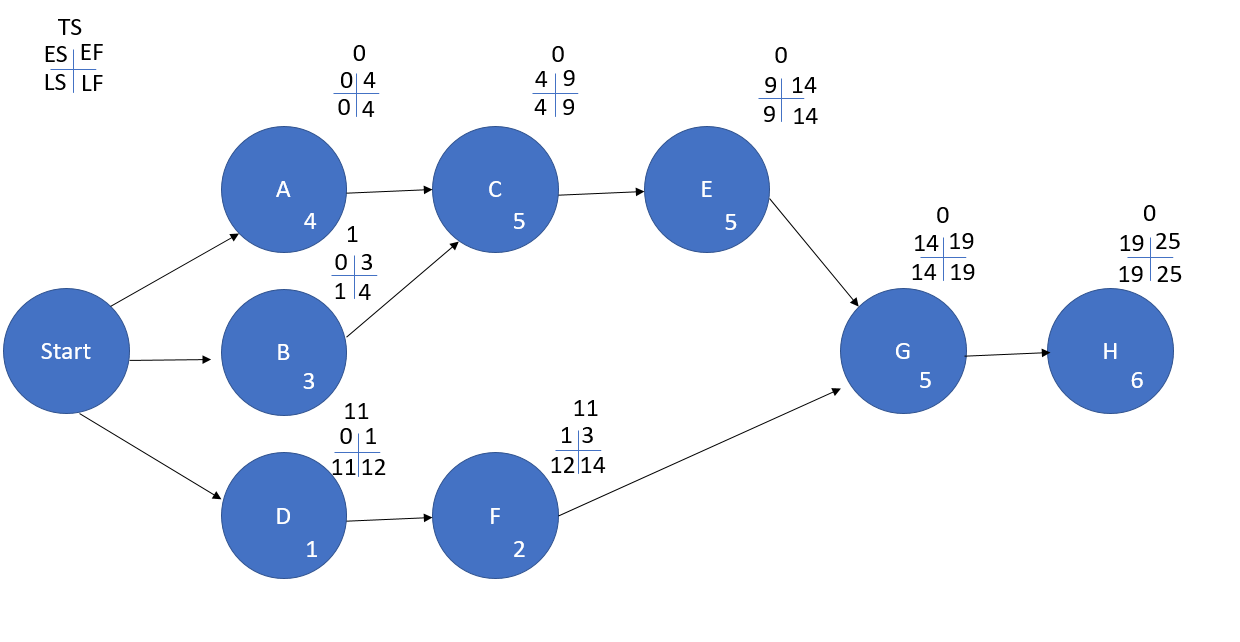
The total slack on a project can be measured through the PND. The reader is suggested to read the previous section “Defining the Project Network Diagram” in order to follow the guidelines coming. The total slack on a project is not about how many workers that fall asleep on their desktop. Neither is it about how slow people are. The total slack is a measure of “time buffers” being the difference between the latest finish and earliest finish. This means that a task can be done as the manager wishes, freely between these boundaries of time. The formula is:
TS (Total Slack)=LF-EF
This formula is applied to every task, and the results are shown above the crosses for every task, on Figure 7
As it is seen, there will be 0 slack on the last task. Often, the slack is also referred to as slippage. This might be a bit more of an intuitive name, since the number will show the allowed slippage, in number of days, that a task can slip, while the project still finishes on time. This can also be a tool for a project manager, during the project, to reallocate workers or other recourses from one task to another, where there is less slack. Basically, this will give a total visualization on where the manager should prioritize, and how resources should be located.
Critical path and overall duration of project
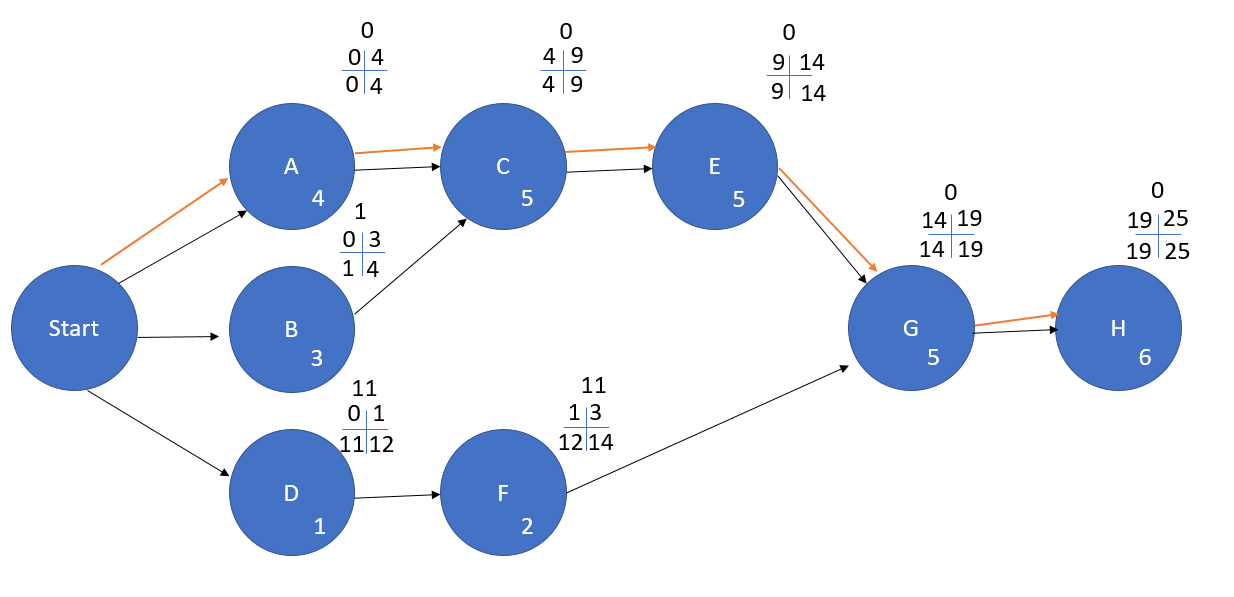
The critical path is the path with the least allowed slippage. This is the path that for all sake should be respected to maintain the overall duration of the project. Therefore, the critical path for this project example would be: A, C, E, G, H. This is the line with 0 slack indeed. This tool is a very powerful tool for project managers, and it can be used during the project as an active measuring tool of how the project is progressing, amongst much more. The critical path is shown with orange arrows, as it is seen in Figure 8
References
[1] IEEE ENGINEERING MANAGEMENT REVIEW, VOL. 45, NO. 2, SECOND QUARTER, JUNE 2017 [2] https://www.inloox.com/company/blog/articles/the-importance-of-time-management-aspects-of-project-management-part-1/ [3] POLISH JOURNAL OF MANAGEMENT STUDIES, Manole A.L., Grabara I, 2016, Vol. 14, No.2, pp. 146 [4] Montecinos, J., Ouhimmou M., Chauhan, S. – Waiting-time estimation in clinics – 2016 International Transactions in Operational Research [5] http://quantmleap.com/blog/2009/10/monte-carlo-simulation-for-dummies/ [6] https://www.youtube.com/watch?v=URdxhl_8qIE&t=5s
