Decision Tree
Contents |
Introduction
Background
The concept of decision tree is undoubtedly related to other concepts, such as mathematics and statistics. In order to trully understand its concept, a project manager, before interfering with constructing decision trees and evaluating decisions, must have an overview of some introductory terms, but important aspects concerning decision trees. Some introductory terms such as Decision making', Bayesian Probability and Risk/Expected ValueExpected Value are explained below:
Decision Making
Decision making in project management is a problem-solving process. The project manager makes decisions to face and solve the problems and challenges. The logic of this process is quite simple. After the identification of the problem, a decision needs to be made only if there are different alternatives or different solutions. If there is also one solution, the project manager tries to consider all the implications that will occur from this solution. If there are more than one different alternatives, the project managers try to make the decision that will lead the project and the company into prosperity. Moreover, these decisions must be made in timely fashion.
Bayesian Probability[1]
The Bayesian interpretation of probability argues that the probability  of an event
  is considered as the degree of belief that
  will occur:
P(A) = degree of belief that A will occur
The degree of belief is a reflection of the state of mind of the individual, that is based on his experience, expertise and preferences. The Bayesian interpretation of probability is subjective and person-dependent. That means that different person may calculate different probabilities that an event will occur. The Bayesian interpretation of probalities may be based on the statistical inference and frequentist inference. The degree of belief is also named as prior probability. The Bayesian probability is used in the modern decision-making and risk analysis, so it is of utmost importance for decision makers and porject manager to know its concept.
Risk/Expected Value[1]
Risk or Expected Value can be defined as the expected consequences derived from a given activity. Usually, the term risk is referred to the expected costs, while the term expected value is used for the expected gains from an activity in an organization. However, the calculation procedure is exactly the same for both of these terms.
Considering an activity with only one event with potential consencequences  the expected cost
  or expected value
  is the multiplication of the probability that this event will take place
  and the consquences which arise from the occurence of the event:

If n events with concequences/costs  and probabilities
  , respectively, may result from an action, the total expected value associated with this action is equal to the sum of the risks of the individual possible events;

Decision Tree
Purpose
Decision Tree is a graphical method for illustrating the flow of decisions faced on a project depending on the possibility of each decision. A decision on a project cannot be considered as a single, isolated occurrence, but instead as an outcome of several interrelated decisions. Decision Tree is a mathematical modelling technique, used as a Risk Analysis and Management Tool. Through it, the project managers can observe options, which can be used for decision making and management of the project. The Decision Tree can assist them with probabilistic cost estimation of a project, incorporating risks of uncertain events, which may happen, and supply of alternative options and scenarios. Despite, some limitations and challenges faced by its application, decision tree analysis displays a powerful quantitative technique for different future alternatives, taking into account not only probability, but also choice.
Structure
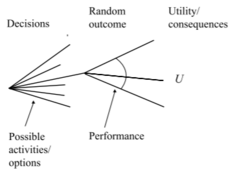
Decision trees are quantitative diagrams with nodes and branches representing different possible decision paths and chance events. [2] The decision tree is read from left to right. More specifically, a decision tree consists of the following elements
- Root node: It is the leftmost node of the decision tree
- Decision node: It is represented by a small square.
- Decision tree branches: These branches which emanate from the right side of the decision nodes, compose the set of alternative decisions – solutions, which can be pursued. The project manager can select and put into application, one and only of these branches.
- Chance node: Chance nodes are represented by small circles in the decision tree, indicate that a chance event is expected at that point. The number, which can be seen on the branch of each of these nodes, presents the probability of the decision on each branch to occur in the chance node.
- Endpoint: The right end of each path of the decision tree is named as endpoint. Every endpoint in the decision tree shows the final outcome of following this particular path from the root node to this particular point.
Advantages of decision trees[3][4]
Transparency
One of the major advantages of using decision trees is their transparent attributes. By using decision trees in decision making and risk analysis all possible options for a decision can be evaluated accurately and connected simply with their outcomes. The decision maker can easy compare different alternatives, deciding eventually on the best action of the organization. Moreover, the use of different symbols for the different elements of decision tree contribute to its clarity.
Preciseness
The concept of the decision tree, which a monetary value and a probability can be assigned for every decision and action, gives this tool specifity, compared to other methods.
Simple In Application
Decision trees are also in ease of use. The decision tree usually offers a graphical illustration of the problem and various alternatives in a simple and understandable way that requires no explanation.
Flexibility
Another of the decision tree analysis advantages are that it provides the relationship among various actions and thereby, is represantation of the flow of events, and as such, stays robust with a little chance for errors, provided, however, that the inputted data is correct and accurate.
This ability of the decision tree to follow the natural flow of events, as in many cases, the paths of the decision trees follow the project schedule allows the connection and incorporations with other applications as influence diagrams. Decision trees can be combined with other decision-making techniques such as PERT charts and linear distributions
Construction of decision tree
For an accurate construction of a decision tree, a project manager needs to conduct the following steps
- Construction of a logic tree, usually from left to right, including the decision and chance nodes
- Addition of the probabilities of the different states on the branches of the tree. The logic tree is, therefore, transformed into a probability tree. Caluclation of the probabilities in the endpoints. The sum in the probabilities in the endpoints must be equal to one.
- Addition of the conditional outcomes. The construction of decision tree is completed.
Decision Tree Analysis
The decision tree analysis can be ranged from simple calculation procedures, which can be estimated with hand calculations, to complex algorithms, that require computer software for their solutions. However, the basis for calculation of the best action in a decision tree, is rather simple. Also,
Example
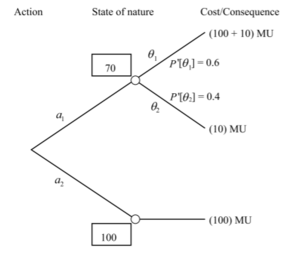
A decision has to be taken whether the company should fund project  or project
  , as it can be seen from the Figure 1. Each project has possible outcomes. Project
  is the establishment of a new new well, while project
  is the construction of a pipeline from the existing well.
For project  the probabilities for two possible outcomes are:

|

|
|---|---|
| Capacity sufficient | Capacity insufficient |
The probabilities for project  are:
are:
![P[\theta_{1}]](/images/math/1/f/7/1f731a141436252ec1919f799eb531a7.png)
|
![P[\theta_{2}]](/images/math/9/2/f/92f65bb5c5bffa086e06fbc0696fca65.png)
|
|---|---|

|

|
Due to the prior information the expected cost for project  is:
is:
![EC_{\alpha_{1}} = P[\theta_{1}] * C_{\theta_{1}} + P[\theta_{2}] * C_{\theta_{2}} = (0.60 * 110) + (0.40*10) = 70](/images/math/6/d/8/6d87753fa307ee38361794d35afa5cca.png)
For Project 
 the capacity of the pipeline from the existing well will always be sufficient

As the decision maker wants to minimize the cost, which is represented by the expected cost, project  should be pursued.
Different types of Decision Tree Analysis
According ot the state on available information at the time, when the decision analysis is conducted, three different analysis types are distinguished: Prior analysis, posterior analysis and pre-posterior analysis. Due to their importance in practical applications in decision analysis, their logic and possible outcomes are briefly discussed in the next sections.
Prior Decision Analysis
A prior analysis is the basis for the comparison between different activities. The example in the above section is an example of prior decision analysis
Posterior Analysis
A posterior analysis is used to evaluate the effect of activities, which factually they have performed. More specifically, in posterior analysis, additional information is available. Consequently, the probabilities that are used for the prior decision analysis can be updated, leading eventually to more accurate estimations and, therefore, more accurate decision-making.
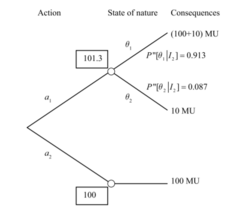
Example
One of the advantages of decision tree analysis is that if additional information is available, it can be added to the current decision tree. Due to this fact, the probability structure of the new decision tree is updated. However, the structure of the decision analysis remains the same as in prior decision analysis.
If an experiment is conducted and provide us the result  , the updated probability structure of the tree is named
 ![P'[\theta_i]](/images/math/6/4/1/641dd7c0c5dd710ebe9a7215f33aea9e.png) and can be calculated by using the Bayes theorem:
and can be calculated by using the Bayes theorem:
![P'[\theta_i] = \frac{P[z_k|\theta_i] P[\theta_i]} { \sum_{j=1}^{n} P[z_k|\theta_j] P'[\theta_j]}](/images/math/c/0/5/c055289b1ce4e121f65f2e46d31c77fa.png)
Pre-posterior Analysis
With the use of pre-posterior analysis, optimal decisions can be identified, concerning activities that may be performed in the future. A project manager-decision maker often has the possibility to find and buy additional information through an experiment, before a choice is made. If the cost of this information is small, compared to the potential value of the information, the decision-maker should buy this information.
Limitations of Desicion Tree Analysis
Decision Tree Analysis has some inherent limitations in its application, as
- Inadequacy in applying regression and predicting continuous values
- Possibility of false relationships
Considerations and Challenges
Complexity
For more sophisticated problems the process of constructing a decision tree can be complicated. Although decision trees are an easy tool for decision making in comparison with other tools, constructing a decision tree with many branches can be a complex and time-consuming task. Scores and hundreds of branches and so many potential outcomes may be involved in a complex decision tree. The major difficulty on this lies on the accurate calculation of the probabilities on the many different branches. In these cases, the decision maker should have enough expertise and experience to successfully. (impact hub)
The Human Factor
Project managers – decision makers are often faced with having to explain why one course of action is better than the other in the face of uncertainty. Even if the project manager has made an accurate representation of a decision tree, it is necessary that the managers of other departments of a company will understand its concept and its results. Moreover, some managers are more interested in the effect of a decision on their department, than in the effect that has in the whole organization. It is clear that even in quantitative analysis methods in project management science, in the end, the human factor has a vital role.
Representation of data
This technique also demands that all factors have to be represented quantitatively – cost and consequences are usually expressed in financial terms, and probability must be estimated for all chances. In some cases, it is rather difficult to have a precise estimation for the probabilities and the expected values. Taking also into consideration the complexity of decision trees, a miscalculation in a probability in a branch, may result in completely misleading outcomes and, eventually, to the wrong decision and action.
Risk Averse and Risk Neutral Organizations
In decision tree analysis, it is assumed that the organization and the project managers will select the decision according to the analysis. This means that a decision will be chosen based on the possible maximization of the expected value or on the possible cost minimization. This behavior is called ‘risk-neutral’ and is characteristic of an organization which takes into consideration long-term revenues, by applying the decision with the maximum expected value. However, many times, there is a slight probability that this decision may also result in huge losses. In the real world, many organization, if not the most, are unwilling to be dealt with situations, where there are vulnerable to large losses, if even there is a small chance of that. The small possibility of failure overcomes the large possibility of great gains. This behavior of the organization is called ‘risk averse’. This organizations tend to maximize their expected utility than their expected value. This utility function may give a significant negative weight to the possibility of large losses, resulting in a different optimal decision form the analysis. Nowadays, it is possible with decision tree software to design a utility function that reflects the organization aversion to large negative consequences.
References
- ↑ 1.0 1.1 Faber, Michael Havbro (2010) Statistics and Probability Theory - In Pursuit of Engineering Decision Support, Publisher: Springer International Publishing AG.
- ↑ Kerzner, H., Ph.D., (2006), ""Project Management: A systems approach to planning, scheduling and controlling"". Ninth edition
- ↑ Advantages of using decision trees in project management [URL:http://www.innovativeprojectguide.com/project-risk-management/9-project-risk-management/136-advantage-of-using-decision-trees-in-project-management.html]Retrieved on 2 October 2017
- ↑ Advantages of decision trees analysis [URL:http://www.brighthubpm.com/project-planning/106000-advantages-of-decision-tree-analysis/]Retrieved on 2 October 2017
Annotated bibliography
- 1. Winch, G. M. (2010), "Managing Construction projects". Second edition
- Summary: The book presents a holistic approach of construction management. The basic principles of construction project management are presented along with different tools and techniques that aims to enhance construction performance and provide innovative techniques. The use of information and communication technologies is also a point of interest in the book.
- 2. Kerzner, H., Ph.D., (2006), "Project Management: A systems approach to planning, scheduling and controlling". Ninth edition
- Summary: The book illustrates the basic principles of project management. The book is targeting for enhancing the project skills of not only students, but also executives, pointing out that project management can be related to every profession apart from engineeering, including information systems and business.
- 3. Maylor, H. (2010), "Project Management". Fourth Edition
- Summary: This book cover all the topics of project management, focusing in the theory, as well as in the application and usage of the ideas discussed in it. The book points great emphasis into the 4D-model of the project.
- 4. Flyvbjerg, B. (2008) "Curbing Optimism Bias and Strategic Misrepresentation in Planning": Reference Class Forecasting in Practice, European Planning Studies Vol. 16, No. 1
- Summary: This paper presents the method and illustrates the first instance of reference class forecasting. The paper targets in the inaccuracy of the financial appraisal in planning in construction, explains them in terms of optimism bias and strategic representation and present a method of eliminating this inaccuracy.


