Scheduling techniques in Project Management
“The Project Management is a management system that aims to results”.[1] The goal of a project can only be reached through precise scheduling techniques that take into account all various constraints such as time and economic resources. Techniques such as PERT, CPM and GANTT are the most used to plan into details a project, prevent uncertainties and avoid risk. These three techniques complete each other and offer a wide range of scenario that could occur during the development of a project The aim of the scheduling techniques is to reach the goal on time without wasting precious and limited resources. On the other hand it’s an important tool to prevent in advance future situations and to promptly identify future issues that can compromise the success of the project. Thought the use of these techniques all the single steps of a project are defined in advance, the goals are clear and the resources are properly allocated.
Contents |
Introduction to the Project Management
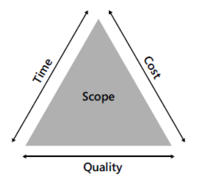
“A project is a sequence of unique, complex, and connected activities that have one goal or purpose and that must be completed by a specific time, within budget, and according to specification.” [2] Every project has therefore constraints that can be summed up into the Project Management Triangle.
Every project has therefore constraints that can be summed up into the Project Management Triangle. The most important interlinked constraints of a project are: time, cost and quality. The figure on the right shows that the value of two constraints, they determine the third one. For example, you can build a house quickly with a really high quality but it will cost heaps. On the other hand, you can choose to save up and reduce costs and build it in short time but the quality won’t be excellent. Through this example, it can be understood that projects has to deal with limitations and with compromises. Managing and supervising a project is not an easy job and its management is the crucial issue. "The Project Management is the application of knowledge, attitudes, techniques and tools to the activities that form a project to reach successfully the goals." [3]
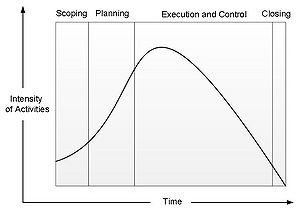
According to the PMI® - Project Management Institute there are five steps to determine the entire managing flow of the process from the beginning to the end:
- 1. Scoping
- 2. Planning
- 3. Executing
- 4. Controlling
- 5. Closing
Five Steps in Project Management
- Scoping
This phase answers the question: “What shall be done?”. First of all the output of the project has to be something that reflects the needs of a specific target costumers. Afterwards the draft of the scope, it’s necessary to make sure that all the needed resources are on board to start with the project.
- Planning
The question for this step is “How are we going to do it?”. It’s crucial to define all the activities that must be done for the project. A valuable tool to do this is the WBS (Work Breakdown Structure). Defining the people, creating the project team, estimating costs and time is the heart of the Project Management. PERT (program (or project) evaluation and review technique) and Gantt Diagram are two important tools to analyze into details each step of the project to find out the time to reach its conclusion.
- Executing and controlling
These are two phases that can be run simultaneously: the first one refers to the execution of the planned work whereas the second one checks if the actual development of the work is on line with the planned one. If there are gaps between these latest there must be additional planifications. This big step is extremely important because it covers the launch of the project till its end.
- Closing:
It includes all the necessary activities for the closure of the project. Here the question could be: “How well did the project go?”. At this step it’s important to analyze the acceptance of the good/service from the customers, to investigate how was the management of the project, its pros and cons and some possible improvements. The lasts thing that belongs to this phase is the communication to all the stakeholders about the conclusion of the project and the reached goals.
The step is going to be analyzed in this article is the Planning. Scheduling techniques are extremely important to plan into details how the project is going to be developed. It’s nearly impossible to make decisions about a project without any scheduling tools. They are fundamental to avoid as much as possible risk and uncertainty. They are really helpful to have a wide view of all the different scenarios that could occur.
PERT (Program Evaluation and Review Technique)
PERT (Program Evaluation and Review Technique) is a graphical scheduling tools to show the project’s timeline. It was first developed by the United States Navy for the Polaris submarine missile program in the 1950s. Through the use of PERT the Project was finished 2 years in advance and this showed the importance of this scheduling technique. Afterwards it kept on being used in other fields thanks to its excellent productiveness. PERT started being used in all the army industries, governmental institutions and private industries. Only during the 60s this technique became public and started spreading in various fields. [4] Through PERT is possible to keep under control the project’s activities using the visual representation that keeps in mind the interdependencies among the activities that are necessary to the conclusion of the project. This tool doesn’t schedule the activities (as Gantt diagram) because the activities are considered with unlimited availability. In this context activities have only independencies and this means that some of them can only come after the completion of others. PERT is one tool that saves up in average 20% of the duration of the project as well as its cost. [5]
The PERT diagram is formed by:
- Activities: they represent the tasks to be completed. They should include a description and the expected duration. The key activities that are essential for the project and that can be considered as intermediate finish line are named milestone.
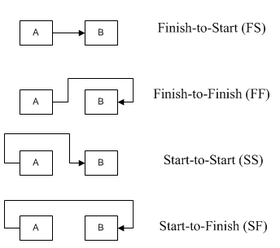
- Connections (or constraints): they show the existing relation between the activities that can be FINISH-START, FINISH-FINISH, START-START and START-FINISH.
- FINISH-TO-START: the start of the successor task depends upon the completion of the processor’s work.
- FINISH-TO-FINISH: the completion of the next task depends upon the completion of the predecessor’s task.
- START-TO-START: the start of the successor task depends upon the initiation of the processor’s work.
- START-TO-FINISH: the completion of the next task depends upon the start of the predecessor’s task.
- Preset Date: Some activities can have a significant impact on the critical path and their deadline becomes a sort of constraint. For this reason some of them have a prefixed date and cannot be run before that date or not after that date and so on.
- Calendar: PERT diagram needs to specify working ways, weekend days, holidays and so on to calculate in the exact timetable.
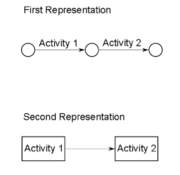
There are two ways of representing PERT:
The first method AOA (activity on arrow) represents the activities through arrows and the starting event and the end event are represented by the nodes. This was the first representation of PERT and it shows exactly the network but it’s difficult to use because it implies the use of “fake” activities to be able to show all the links between the various activities.
The second method AON (activity on node) to represent PERT uses rectangles to show the activities and the constraints between the activies are shown by arrows. This system is easier and is called “Precedence representation” though that it’s possible to show all the constraints without adding extra “fake” activities.
In PERT diagram is fundamental to calculate the times for each activity that are going to be calculated through two steps, one onward and the other one backward.
After is known the network between the activities and their duration, the PERT diagram can be started. The times that are going to be calculated are:
The early start time (ES)
The early finish time (EF)
The late start time (LS)
The late finish time (LF)
Time estimations
So far in PERT was used a fixed time for each activities. In reality it is more realistic to have three different time estiamtions such as optimistic time (O), Medium time (M) and Pessimistic Time (P). Through this it is possible to calculate the expected time (TE) for each activity. TE = (O + 4M + P) ÷ 6
Step by step to construct a PERT Diagram
- STEP 1 – Arrange the network of the various activities and enter the Activity Name and Duration.
- STEP 2 – Going onward (from the start to the end) assing the Early Start (ES) and Early Finish (EF) of every activity. The last activity, through its EF, will show the total duration of the project.
The first activity will have 0 as ES and EF as its duration. The next activity will have ES as the previous activity’s EF. In case one activities has more than one previous activity who’s dependent with, its ES is the latest EF. It makes sense because this actity cannot start before the previous ones are finished.
- STEP 3 – Going backward (from the end to the start)
This step is fundamental to see if there’s some possible slacks without delaying the whole project and which is the critical path. The last activity has LF=EF and LS=ES. The previous activity have LF as the next activity LS. In case an activity has more than one following activities the LF has to be taken is the worst (higher). LS is then caluclated as LF – duration.
- STEP 4 – Calculating the slack
Once all the ES,EF,LS,LF are completed it coud be calculated the Slack. Slack = LS – ES = LF – EF In case the slack is more than 0 it means that that activity can be delayed the amount of time of the slack without delaying the whole project. If the slack is equal to zero it means that that’s a critical activity that if is delayed the whole project will be done after the deadline.
Example of PERT
| Activity | Predecessor | Duration (weeks) |
|---|---|---|
| A | / | 5 |
| B | / | 4 |
| C | A | 3 |
| D | A | 4 |
| E | A | 6 |
| F | B, C | 4 |
| G | D | 5 |
| H | D, E | 6 |
| I | F | 6 |
| J | H,G | 4 |
REFERENCES
- ↑ Miscia S., 1994, Il Project Management, Quaderni di Formazione Pirelli, Milano.
- ↑ Robert K. Wysocki, 2009, Effective Project Management: Traditional, Agile, Extreme. Fifth Edition. Indianapolis. [Available online on Google books] pag. 6
- ↑ Project Management Institute®, 2000, A guide to the Project Management body of knowledge. Pennsylvania. [Available online]
- ↑ Booz, Allen & Hamilton, 1963, PERT Planning and Control Procedures: Deere & Company, Moline, Illinois.
- ↑ Booz, Allen & Hamilton, 1963, PERT Planning and Control Procedures: Deere & Company, Moline, Illinois.


