Milestone trend analysis
Created by Ann Sofie Grube Kjeldsen, February 2022
One of the most crucial elements of successful projects and project management is to have clear project goals [1]. A critical path in reaching project goals is by defining project milestones. Milestones are a specific period in the project that showcases what has been accomplished and allows the project manager to see the progress of a project. Milestones portray an essential decision or point in a project lifecycle when the project team is supposed to deliver deliveries before the final execution [2].
Milestones monitor the progress of any project and help the project manager classify different tasks, thereby identifying critical paths. It is a practical way to easily share the progress and health of the project with stakeholders and the project team [3]. To monitor and compare the progress of each milestone with the planned schedule, a simple method, Milestone Trend Analysis (MTA), can be used to navigate through uncertainties and limited information. It allows project managers to recognize deviations and trends from the planned schedule. MTA is a graphic method for comparing the scheduled date of the milestones and the various point in time [4].
Contents |
Introduction
According to ISO 21502 and PRINCE2, milestones and "gates" or decision points based on the project life cycle, combined with a detailed project plan of the phases, should prepare the initial phase of any project. The project plan provides a statement of the time, cost, quality, and scope performance. The project plan identifies management stages and milestones as a baseline to monitor progress management [5] [6]. Each phase in the project plan should have a defined start, end, and a specific milestone derived from decisions, key deliveries, outputs, or outcomes. These decisions are often referred to as "gates" and are an important part of project management. The project manager should collect and analyze performance and progress data to access project progress concerning the agreed project plan, including e.g., completed work, milestones achieved, and costs incurred [6]. To access project progress the project manager could i.e., use MTA as a compatible tool.
Milestones and Trend Analysis
Milestones
The definition of a milestone is: “Milestones are significant events in the project, which divides the project into manageable parts” [5]. A project milestone is a project management tool that represents significant events and a specific future point in the project. Milestones depict prioritized tasks, key deliveries, approved stakeholders, etc. They focus on highlights of the work rather than going into details. They describe more precisely when one wants to achieve an event that moves one closer to the end of a project [5].
The following questions can help the project team to develop milestones [7]:
- When does the project start?
- When is the deadline for the project?
- When do the key milestones occur?
- How is the achievement of a milestone measured?
A milestone can have several functions in project management. For example. they can be used to show Stakeholders the project’s progress [8][9]. Some of the most common milestones are listed below [7][10]:
- Approval from all stakeholders
- Reporting completed deliverables to the client
- Completing critical tasks
- End of project
Since milestones are a portrait of an event that has taken place, they are ideal for staying on track with project deliverables. Milestones do not have a specific duration; therefore, they can easily divide the plan into sections associated with the milestones to monitor activities and improve efficiency. Generally, the correct number of milestones and their duration is not determined. Each project is different, and each project has various length of phases, and some are more intensive than others. There is no wrong or correct number of milestones, however, with too many, they lose their value. That being said there should be enough milestones to measure the progress of a project [5].
Trend Analysis
A trend is a series of data over time. A trend can be positive or negative depending on how and what data is analyzed. In project management, a trend can analyze historical data, and thus make forecasts for the future. The underlying trend forecast helps a project manager to manage and make decisions [11].
Trend analysis analyzes trends and points in turn within the project. In project management, trend analysis is a mathematical technique predicting future events based on the recently observed trends. Trend analysis is build-on the idea; of what happened in the past, creates an idea of what could happen in the future. It is a tool used to collect information and spot a specific pattern within the planned schedule. Trend analysis can predict future events and also estimate uncertainties in a project. Tracking costs and whether activities are on schedule limits possibilities and estimates uncertainties. Trend analysis can be referred to as a project manager's quality control of the project. It warns the project manager, that problems may occur later in the schedule if trends continue. Thus, information must be available in the early phases of the project team can analyze and prevent any irregularities [11].
Schedule Management
For any project team, it is only possible to implement goals in a plan if it contains defined activities in a schedule that defines when to be executed them. There are many approaches towards planning a project - it can be a manual schedule or a computer-based control tool [5]. The purpose of schedule management is to reduce unexpected changes in the schedule as best as possible. It requires that activities in the plan are on time or ahead of time. To determine a critical path or identify alternative methods planned schedules must have described dependencies [6]. A project manager's task is to check that the project scope is delivered on time within the original project constraints. It is done by monitoring progress and comparing the current project status with the planned schedule. Control of the schedule involves phase monitoring, project-related activities, etc., also the management of schedule changes and milestones [6]. Implementation of techniques, such as Earned Value Management and Milestone Trend Analysis, can help monitor the process and predict future performance methods.
To add value to a project’s planning milestones can be added. For added value, one can combine them with methodologies such as Program Evaluation and Review Technique (PERT), Critical Path Method (CPM), or Milestone Trend Analysis. These tools together with the settled milestones can provide an overview of the project's current state. Status of the project progress provides regular monitoring of the project – it displays exactly whether the schedule is met. If the project plan is carefully deduced and evaluated, the chances of the project succeeding are high if the plan is also followed. As milestones are versatile, they are an important element of the project plan. They can calculate slack in the project timeline, check and track progress [7].
An important part to remember when using milestones is to use them for something other than planning. They are also for celebrating project results. A milestone reached means that the project team has done something right, such as accomplishing important delivery. When a project manager actively uses milestones to recognize the project team's performance, it breeds a positive relationship with the team and creates trust between the manager and the employees. Overall, this contributes to a productive project [12].
Milestone Trend Analysis
Milestone Trends Analysis is from the perspective of "Uncertainty". In this perspective, the pivot is the lack of knowledge, uncertainties, and how to minimize these throughout the lifetime of a project. A part of uncertainties is the ability to anticipate these uncertainties and plan how to respond to new opportunities and risks [13].When the project manager considers whether to use Milestone Trend Analysis (MTA), the following questions can be considered: Can the schedule be met? Should indisputable deadlines be postponed, or can delays be compensated efficiently? Milestone Trend Analysis can manage time processes and answer the above questions.
Milestone Trend Analysis requires defined milestones in the project. Each milestone needs a defined deadline for when it should be completed. However, it also often happens that milestones are not completed either on time or completed in general, i.e., if there is an incorrect delivery of crucial materials. The many responsibilities build on each other and individually contribute to the risk of incorrect deliveries, which can endanger the health of the project [10].
Milestone Trend Analysis is primarily used to assess and control the high risk of project delays. Therefore, when preparing tasks and schedules, buffers for disruptive factors should be included. The analysis enables the team to identify bottlenecks in advantages and initiate measures to ensure that tasks are completed before the deadline. If the project team is incapable of correcting the delays/bottlenecks, the tool will be able to help inform any stakeholders about delays in advantages. MTA is also suitable for the overall evaluation of the project as the project manager can check where the error in the planning is and thereby learn from it for future projects [10].
How to implement MTA in a project
Normally, a project team prepares the project milestone in the initial phase of a project. The number of milestones depends on the length and complexity of the project – a long-term and complex project benefit from a milestone trend analysis. A short-term project can also benefit from using MTA, however, it can be advantageous not to evaluate a project's progress before it is completed. To implement MTA correctly the team has to set a deadline for each milestone. The milestone trend analysis is thus a visual line graph to evaluate project progress according to the deadlines. Trend lines in the MTA graph can then create a connection between milestones. Milestone trend analysis can be easily performed if the following 4 steps are followed.
| 1. Set milestones | Firstly, a project manager should establish a project team with different qualities. The project manager should work with the team and encourage them to deliver the expected result. Next, the project manager should decide in what order the milestones should be achieved, possibly with a priority scale from 1-5. To determine this, the project manager can advantageously use a graph, to plot the milestones and their end-dates. The x-axis displays the milestones and the y-axis indicates the dates. The line through each milestone is the project course baseline. |
| 2. Evaluate milestones | Once a milestone is completed, the completion date can be marked by the project team or the milestone responsible. This helps the project manager to collect data to determine the state of the project and locate the responsible team or team member for the completion of the milestone. Evaluation of milestones governance, team efficiency, and progress. The graph displays future milestones and their completion to involved stakeholders. |
| 3. Monitor progress | The most crucial part of the project is the delivery of the milestones and the whole project. The project manager can draw points in the MTA for each completed milestone. Milestone trend analysis can reveal deviations between settled delivery dates and the actual delivered date. |
| 4. Determine trends | The MTA allows any project manager to focus on the tendencies occurring through projects. The determination of trends and discrepancies can inform the project manager’s next project and help make strategic decisions. It is worth noticing that discrepancies should not necessarily raise concern, but they can be used to adjust expectations to the project manager and the team. |
Graphical application
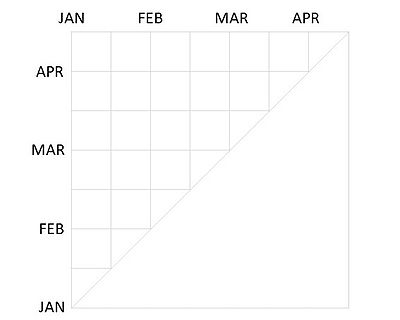
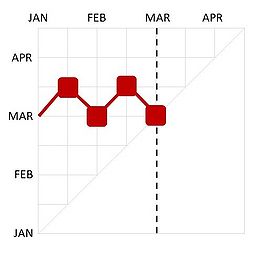
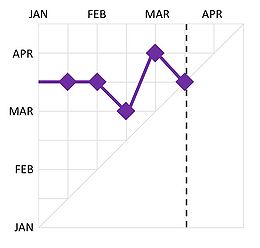
Milestone trend analysis is a simple diagram that shows the different milestones and the project process. The Milestone Trend Analysis is a triangle-shaped chart. On the x-axis, you see the reporting dates, and the planned dates are on the y-axis. Each milestone is represented by a trend line moving along the x or up the y axis. The diagonal line on the right side represents the project deadline [10]. The earlier the deadline of a milestone, the lower it will be placed on the y-axis.
The trend lines direction has different meanings regarding adherence to the schedule:
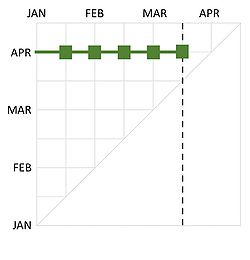
Horizontal trend line: the milestone is completed on time.
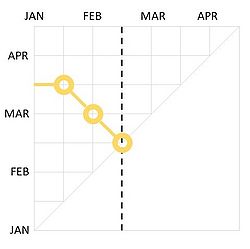
Declining trend line: this means that the project milestone is ahead of schedule and the planned safety buffer is too large.
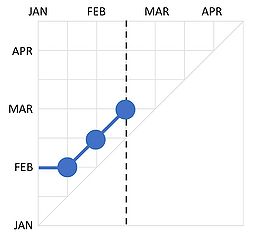
Rising trend line: a rising trend line means that the milestone is delayed. The delays can be compensated with embedded buffers and measures. If the trend line rises a lot, you should re-evaluate the project's submission data and possibly set a later date.
Zigzag trend line: this occurs because some deadlines are reached earlier than first assumed and others later than planned. This trend line is an indication of discrepancies in the schedule. Discrepancies cause the schedule to be analyzed in detail for further optimized planning and processes.
Non-linear trend line: this means that there is an unrealistic milestone date.
Example of application
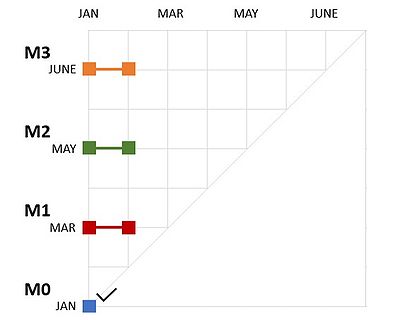
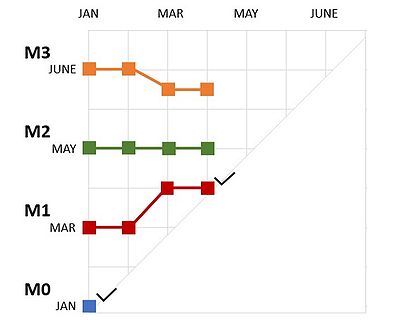
In this specific example, the milestones are defined as M0, M1, M2 and, M3. None of the milestones represents an actual milestone, but a demonstration of how different milestones within a project could be monitored. The y-axis is the planning line. If the project starts on time, the first milestone (M0) can be ticked off. By the end of the implementation phase in the first month, January, the project manager asks his team for qualified guesses when milestone M1 to M4 could be reached. Then their answer is then written into the chart:
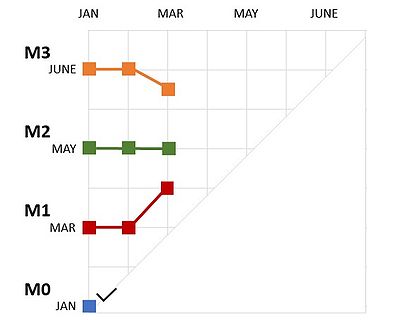
In the next month possibly February, the project manager then again asks the team members for their best guess when the milestones could be reached. The possible answer is again written into the chart:
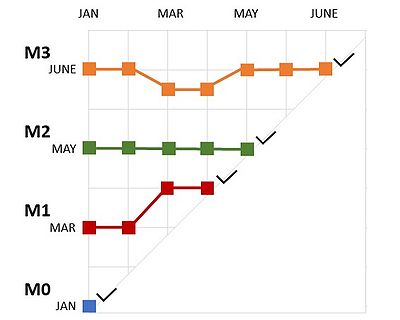
The experts of milestone 1 (M1) need one more month more, this indicates that the work is delayed and needs closer attention. The experts of milestone 3 (M3) are two weeks ahead of schedule and milestone 2 (M2) is on schedule. To achieve a horizontal trend or a declining trend the team should analyze the situation and decide actions for each delayed milestone.
At the end of Marts, the project manager then again asks when the milestone is reached. By the end of April milestone 1 (M1) is reached. This process continues until each milestone is reached. If a milestone ends up in the white area, either it has not been reached or the milestone did not go as planned.
By illustrating the milestones after each reporting period into the MTA chart, it is easy to follow the reporting period vs. the planned period and thereby obtain a trend for each milestone. This project example was completed with minor delays, but overall on time.
Benefits and limitations
Benefits
Milestone analysis is beneficial for signaling the completion of essential project phases and creating boundaries between work packages. It increases the team's ability to respond to changes and create logical review points. Milestones also provide periodic goals that keep team members motivated. They represent significant results within the larger picture of the project. It also draws the team's attention to the status of the project. Overall, the analysis provides a clear picture of the project's development.
The benefits of milestones are that they help team members and managers with hassle-free project delivery. An identified and defined milestone is the starting point for each project's execution work. Successful milestones can give stakeholders a precise understanding of how the project progresses relative to the original plan. For larger projects involving several teams, resources, etc. helps set up milestones to improve productivity and delivery of the project within time and budget. In addition, they can identify potential bottlenecks and uncertainties that affect important tasks and hinder project progress, and as a consequence, it emanates delays and exceeded budgets[12].
Milestone trend analysis (MTA) is a simple method; the analysis is easy to implement and simultaneously very useful. The presentation of the diagram is clear and easy to understand. The trend line diagram shows the overall time structure. It is easy to interpret and understand even without prior knowledge of Milestone Trend Analysis. The milestone analysis shows the project status and provides valuable conclusions about the work during the post-analysis.
Limitations
Milestones should be introduced early in project planning and should be monitored and updated throughout the project. Milestones are a huge limitation as the project manager may end up with an overambitious schedule due to misjudgments if activities are and their completion is not clarified. They usually only show progress on the critical path and ignore non-critical activities. Therefore, it is common for resources to be shifted from non-critical activities to critical activities to ensure that milestones are met. This often gives the impression that some activities in the project will be ignored.
During a project, it is still important to focus on the whole project progress and the final milestone and not be obsessed with intermediate milestones. Even if milestones are incorporated, it is the final product or delivery that counts, not each milestone.
Milestone trend analysis is a type of analysis that only provides an opportunity to respond to problems, not foresight the exact future or prevention irregularities. Problems can amplify and grow to the point they are unmanageable, resulting in a significant over budget/planning project. The simplicity of the analysis means that the method does not cover all the things that may be necessary for a project. The method is limited to an actual comparison of the status of a task - this means that it does not consider the extent to which tasks are interdependent. In addition, it does not necessarily show the problem areas of a project in time, and they only become visible later.
Annotated Bibliography
Haralayya, B. (2018), A study of trend analysis at KESHAV ENTERPRISES VASANTH. This study is carried out as an analysis of trends at Keshav Enterprises Vasanth in India. The study investigates the tractor segment, a profile of JOHN DEERE company, finance, human resource, marketing, and production of the company. Furthermore, it covers the company’s key management problems and suitable solutions for solving them. To analyze the company’s data and predict future price movements the trend analysis technique can be used.
AXELOS Limited 2017, Project Management: "Managing Successful Projects with PRINCE2" 6th Edition (2017). Prince2 is based on best practice methods from thousands of projects, project sponsors, managers, teams, and so on. The methods and theory from the paper can be applied by any project regardless of its scale, organization, etc. Prince2 consists of four principles: principles (a method for determining whether a project is being managed), themes (this principle describe aspects that must be parallel throughout the project), processes (describes the stage of the initial phases, the project lifecycle, and the termination), and the project environment (a method for tailoring organizations project management).
Danish Standard Association, Project, programme and portfolio management – Guidance on project management ISO 21502. The standard is a document that guides concepts and practices for project management – a guideline for successful project management. The guidelines are applicable for organizations regardless of the complexity of use, the cost and the duration of the project, purpose, and so on. The standard provides best practices based on experienced results within project management. However, this standard only covers topics related to general project management and not program or portfolio management.
Technical University of Denmark - ProjectLab, Project Canvas - The tool for doing projects. The paper consists of an explanation of how to improve project teams’ communication and provides a simplified project overview. The tool is built on methodologies from SCRUM, PMI, and PRINCE2 and covers simple empirically tested tools retrieved from these. The tool is known as, Project Canvas, and consists of 16 elements giving a complete overview of the specific project. It clarifies the four different perspectives, purpose, people, complexity, and uncertainty. The tool is also valuable for teaching – as it gives the students an overview of their project and encourages dialog.
References
- ↑ Hashemi, C. February 22, 2022. The 5 Most Important Elements of Successful Project Management, https://project-management.com/the-5-most-important-elements-of-successful-project-management/, Retrieved February 11, 2022
- ↑ Waida, M. July 17, 2020. What is a Milestone Trend Analysis, https://www.wrike.com/blog/what-milestone-trend-analysis/, Retrieved February 11, 2022
- ↑ Greytrix. April 26, 2017. Benefit of Using Milestones in Project Plan, https://www.greytrix.com/blogs/sagecrm/2017/04/26/benefit-of-using-milestones-in-project-plan/, Retrieved February 10, 2022
- ↑ SAP Simple Finance. Milestone Trend Analysis (MTA), https://help.sap.com/doc/cad8b65334e6b54ce10000000a174cb4/2.6/en-US/63f9bb53707db44ce10000000a174cb4.html, Retrieved February 10, 2022
- ↑ 5.0 5.1 5.2 5.3 5.4 AXELOS Limited 2017, Project Management: "Managing Successful Projects with PRINCE2" 6th Edition (2017),
- ↑ 6.0 6.1 6.2 6.3 Danish Standard Association. December 22, 2022. Project, program and portfolio management – Guidance on project management ISO 21502
- ↑ 7.0 7.1 7.2 Technical University of Denmark - ProjectLab, Project Canvas - The tool for doing projects,
- ↑ Milestone Analysis, https://flylib.com/books/en/1.356.1.73/1/, Retrieved February 20, 2022
- ↑ Westland, J. June 2, 2021. What Are Milestones in Project Management?, https://www.projectmanager.com/blog/milestones-project-management, Retrieved February 20, 2022
- ↑ 10.0 10.1 10.2 10.3 Productivity. August 8, 2019. Successful project management: proven methods, https://www.ionos.co.uk/startupguide/productivity/project-management-methodologies/, Retrieved February 20, 2022
- ↑ 11.0 11.1 Haralayya, B. (2018), A STUDY ON TREND ANALYSIS AT KESHAV ENTERPRISES VASANTH 3LA17MBA20,
- ↑ 12.0 12.1 Yesodharan, S. November 12, 2021. What are Project Milestones, and Why is it Important?, https://www.saviom.com/blog/what-are-project-milestones-and-why-is-it-important/, Retrieved February 11, 2022
- ↑ DTU 'Department of Management Engineering, Our Perspective, https://www.doing-projects.org/perspectives, Retrieved February 11, 2022
