Femern
Contents |
Project Quality Management
Plan Quality Management: Data Analysis[1]
Data Analysis is one of the tools used for Plan Quality management. There are two major techniques used for Data Analysis, which are cost-benefit Analysis and cost of quality.
Cost-benefit Analysis is used for analysis of alternatives, and help determine the most beneficial alternative. This is done by estimating the strengths and weaknesses of the alternatives
Cost of quality can help the company keep high quality and thereby lead to savings. Cost of quality consist of three costs.
Prevention costs are costs used to prevent poor quality. Appraisal costs are costs for appraisal, such as evaluating and testing products, deliverables or services. Failure Costs are costs linked to failure in products, deliverables or services.
Manage Quality: Data Representation[1]
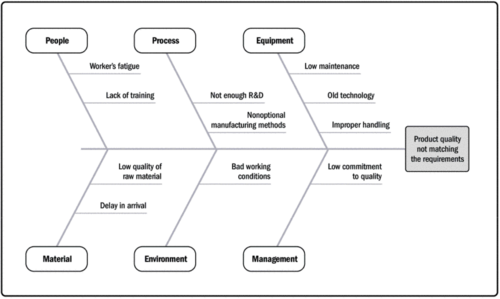
Data Representation is used to show data of an organization. They can among others, show issues and defect in certain areas, which needs more attention. Data Representation is mostly illustrated as a diagram or chart. Types of data representation includes affinity diagram, cause-and-effect diagram, flow chart and histogram.
Schedule Management
Estimation of Activity Durations: Three-Point Estimating[2]
Three-point estimating is a tool used to estimate the duration of an activity. It is used primarily when there is insufficient historical data available to produce an estimate. The tool considers a most likely time (tM), optimistic time (tO) and pessimistic time (tP) to produce the best estimate via the following equation:
tE = (tM + tO + tP)/3
Using this triangular distribution estimation uncertainty and risk can be reduced with respect to single-point estimating. Total project duration may then be estimated by finding the summation of individual activity durations through an integrated activity execution flow chart (e.g. Gantt chart).
Development of a Schedule: Critical Path Method[2]
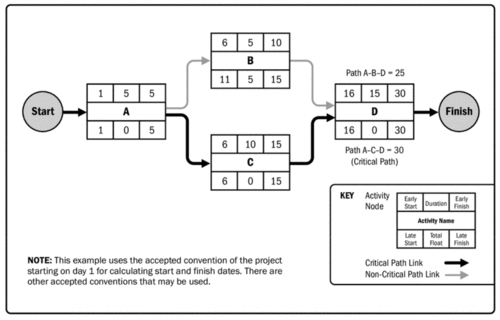
The critical path method is used to produce to calculate the minimum project duration and the amount of schedule flexibility available on the logical network paths within the schedule model. The analysis calculates the early and late start and finish dates of each activity using activity duration estimates. Using the scheduled activity network, the longest activity path (namely 'critical path') is then computed (see path 'ACD' Figure 3). This is used as the project duration estimate. The 'float' of activities not on the critical path is determined, defined as the maximum duration the activity can be delayed by without delaying the project as a whole. This is used to determine the schedule flexibility within the schedule model.
Cost Management
Estimation of Cost: Bottom-Up Estimating[2]
A method used putting the activity of into more details when the cost of work is estimated and the team behind cannot estimate the cost due to lack of confidence in the specific field.
Bibliography
- ↑ 1.0 1.1 https://app-knovel-com.proxy.findit.dtu.dk/web/view/khtml/show.v/rcid:kpGPMBKP02/cid:kt011DXC52/viewerType:khtml//root_slug:8-project-quality-management/url_slug:project-quality-management?kpromoter=federation&b-toc-cid=kpGPMBKP02&b-toc-root-slug=&b-toc-url-slug=project-quality-management&b-toc-title=Guide%20to%20the%20Project%20Management%20Body%20of%20Knowledge%20(PMBOK®%20Guide)%20(6th%20Edition)&page=1&view=collapsed&zoom=1
- ↑ 2.0 2.1 2.2 https://app-knovel-com.proxy.findit.dtu.dk/web/view/khtml/show.v/rcid:kpGPMBKP02/cid:kt011DX7BB/viewerType:khtml//root_slug:6-project-schedule-management/url_slug:project-schedule-management?kpromoter=federation&b-toc-cid=kpGPMBKP02&b-toc-root-slug=&b-toc-url-slug=project-schedule-management&b-toc-title=Guide%20to%20the%20Project%20Management%20Body%20of%20Knowledge%20(PMBOK%C2%AE%20Guide)%20(6th%20Edition)&page=1&view=collapsed&zoom=1

