Lag and Lead
Jacob Lützhøft Christensen s184113
In the field of project schedule management, the terms lag and lead are widely utilised to maintain project schedule by determining possibilities of schedule advancement or delay. A lead is the amount of time a successor activity can be advanced with respect to a predecessor activity. [1] A lag is the amount of time a successor activity will be delayed with respect to a predecessor activity. [1] Traditionally the measure of project success has been limited to concepts of time, quality and cost, however these concepts might not provide a full picture of project success. [2] In the traditional sense of project success, lag and lead has had an important role in fulfilling the need of time management in projects, however the terms of lag and lead are not purely schedule management tools. According to the project management standard PRINCE 2, the status of projects are best measured for one point in time by its key performance indicators (KPI), which should be balanced between qualitative and quantitative measures, leading and lagging indicators, and project inputs and outputs. [3]
A key perfomance indicator (KPI) is a measure of performance that is used to help an organization define and evaluate how successful it is in making progress towards its organizational objectives. [4] These indicators are widely used in organisational contexts, to measure, record, predict and improve perfomance. Indicators for future and past performances are time-based indicators which are distinguished by the terms: lag and lead indicators. This means that lag and lead are not limited to scheduling activities in a task sequence format, but can be used as indicators to determine the perfomance of a project's quality and cost at a given time as well.
Reference link EXAMPLE: team, human behaviour, Stephen Covey
Contents |
Big Idea
Lag and lead can be powerful tools both for project schedule management and as key perfomance indicators. In order to ensure or measure project success it is essential to learn how and when to use these terms, and their limitations.
For schedule management lag and lead are mostly used for sequencing activities. Sequence activity is the process of identifying and documenting relationships among the project activities. [1] The benefit for this is to define a logical relationship between processes, and thereby obtaining an order of activities that is the most efficient path towards the realization of the project, given all project constraints. This order of activities should then be used to formulate a realistic project schedule. For the project schedule to be realistic, the implementation of tools and techniques such as lead and lag times are necessary. Given the uncertainty aspect of projects, usually for a project schedule to be maintained throughout the project's lifetime, lag and lead are used to either advance or delay certain activities in relation to either its predecessor or successor activities. If lag and lead times were determined for all activities before the project commenced the schedule will be unaffected in a situation of a slight unexpected delay.
As key perfomance indicators lag and lead is incredibly co-dependant and can be used as indication for project performance, cost, quality and more.
A lead indicator, is an indicator which is forward looking. Meaning it attempts to show a future perfomance. These indicators can be difficult to determine, as they are prone to subjectivity and error, and can cause debate as to the validity of the lead indicators measured. [5]. Lagging indicators measure historical perfomance, and tends to focus on outcomes. This makes them easy to record, and they are essential for charting progress, however they do not influence the future as lead indicators do. The power of lead indicators is that they have the ability to predict future conditions, and allow you to take preemptive actions in order to achieve strategic goals. However to predict future conditions, it is necessary to use lagging indicators which essentially record current conditions. These indicators can in combination be applied to determine trends and record the degree of success of pursuing these trends.
Application
This section investigates lag and lead as KPI's and for schedule management activities in a PPPM context.
Using Lag and Lead as Key Performance Indicators
Using lag and lead indicators in a project, portfolio and program management context, the tool can be applied in combination with a strategy map and the balanced scorecard. The strategy map is a basic cause and effect model, used along with the balanced scorecard that contains the measure.
The Balanced Scorecard
This section will elaborate on the strategy map and balanced scorecard. ... ...
Section
...
Using Lag and Lead to sequence activities

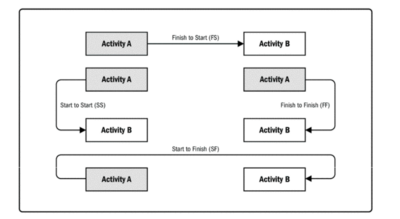
When sequencing activities in regards to a project, determining the order of the activities is crucial. Often one starts with determining the logical relationship between project activities. In the PMI standard for project managing the precedence diagramming method consist of 4 different logical relationships or dependencies. [1] As defined by this standard the four relationships are:
- Finish-to-start (FS) A logical relationship in which a successor activity cannot start until a predecessor activity has finished.
- Finish-to-finish (FF) A logical relationship in which a successor activity cannot finish until a predecessor activity has finished.
- Start-to-start (SS) A logical relationship in which a successor activity cannot start until a predecessor activity has started.
- Start-to-finish (SF) A logical relationship in which a successor activity cannot finish until a predecessor activity has start.
In practice the FS is the most commonly used relationship, and the SF relationship is the rarest. It is possible for two activities to have two logical relationships at the same time, however multiple relationships between the same activities is not recommended. Here, the project manager should determine the relationship with the highest impact. [1]
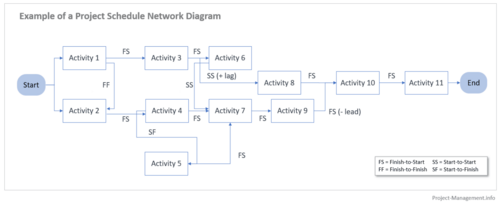
This determination of logical relationships between activities is the first step to build a Project Schedule Network Diagram, and it is necessary in order to determine lag and lead times between activities.
Here is an example of the use of lag and lead times from the PMI standard for project management: [1]

On a project to construct a new office building, the landscaping could be scheduled to start 2 weeks prior to scheduled punch list completion. This would be shown as a finish-to-start with a 2-week leads as shown on figure x. y. For lag, a technical writing team may begin editing the draft of a large document 15 days after they begin writing it. This can be shown as a start-to-start relationship with a 15-day lag as shown in Figure x.
In practice, the activities for figure x could not be properly scheduled without lead and lag times. In combination the the logical relationship, the project manager is able to use lead and lag to properly schedule and visualise the project timeline. This greatly improves the opportunity for project success, as all stakeholders and project members will be able to know the sequence of activities, when the Project Schedule Network Diagram is finished.
Project Schedule Network Diagram

A Project Schedule Network Diagram is a graphical representation of the logical relationships among the project schedule activities. [1] It serves as an important tool for visualisation for the project manager to be able to keep track of activities that has to be completed in order for the project to be completed. The Project Schedule Network Diagram addresses the logical relationships between project activities to show the order of which the activities should be scheduled. It is an overview of the entire project timeline, that can be used for:
- Determining the most important project activities in regards to the time-line.
- Keeping track of the project's development throughout its lifetime.
- Rescheduling activities in accordance with lag and lead times.
- Clarifying the optimal use of lag and lead times and logical relationships between activities to ensure project success.
- Etc.
The benefits of this tool is that the project manager is able to track dependencies and potential bottlenecks, establish workflows and the visual representation can be provided to the stakeholders as well. In this tool lag and lead times are crucial to the development. The project management team should determine the dependencies that may require a lead or a lag to accurately define the logical relationship. The use of leads and lags should not replace schedule logic. Also, duration estimates do not include any leads or lags. [1]
In large projects however, the use of this method to communicate the schedule is very rare, as the diagram can become very complicated. More often a more aggregated view of the schedule is used (ie. a Gantt-diagram). [6] In these cases the Project Schedule Network diagram is used more often as a complex document linking the dependencies and sequences to the overall project schedule and duration. [6]
An estimation of completion time for a project can be determined after the completion of the Project Schedule Network Diagram. Here Lag and lead times are used to decide the Critical Path.
Critical Path Method

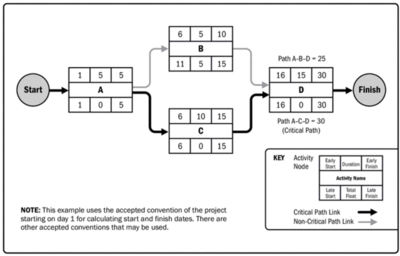
According to the PMI standard for project management: The critical path method is used to estimate the minimum project duration and determine the amount of schedule flexibility on the logical network paths within the schedule model. [1] By performing a backwards and forwards pass analysis through the project network, this method calculates the early start, early finish, late start and late finish dates of all activities without any regard for resource limitations. [1] In figure x, the longest path is shown with black arrows. This path, since it's the longest, determines the earliest completion time of the given project. This is known as the critical path, and it is often the path with the least amount of float.
Float is not to be confused with lag and lead. The float is defined as: "The total float or schedule flexibility is measured by the amount of time that a scheduled activity can be delayed or extended from its early start date without delaying the project finish date or violating a schedule constraint."[1] Where lag and lead times show the possible delay or advancement in relation to other activities, the float is an indicator of the schedule's flexibility. Therefore it makes sense that the critical path, would be the path with the least float time, as delaying an activity in the critical path would usually extend the project finish date.
Limitations
This section will elaborate on the importance of knowing the limits of lag and lead as tools, as well as the limitation of lag and lead as independent indicators.
Not a standalone method. Lag and lead is useless without determining logical relationships.
Finish ... ... ... ... ... ...Lag can also be represented in project schedule network diagrams as shown in Figure 6-11 in the relationship between activities H and I (as indicated by the nomenclature SS+10 (start-to-start plus 10 days lag) even though the offset is not shown relative to a timescale).
... ... ... ... ... ... ... ... ...
References
Examples
- ↑ 1.00 1.01 1.02 1.03 1.04 1.05 1.06 1.07 1.08 1.09 1.10 1.11 1.12 Project Management: A guide to the Project Management Body of Knowledge (PMBOK guide) 6th Edition, Project Management Institute, Inc. (PMI), 2017
- ↑ Project Management: "Managing Successful Projects with PRINCE2" 6th Edition, AXELOS and Office Cabinet, 2017
- ↑ Project Management: "Managing Successful Projects with PRINCE2" 6th Edition, AXELOS and Office Cabinet, 2017
- ↑ Project Management: "Managing Successful Projects with PRINCE2" 6th Edition, AXELOS and Office Cabinet, 2017
- ↑ Lead and Lag Indicators, Intrafocus, Last visited: 14/02/21
- ↑ 6.0 6.1 6.2 6.3 Project Schedule Network Diagram: Definition | Uses | Example, Project management info, Last Visited 28/02/21
