Fishbone diagram for root cause analysis
by Ali Waleed Abbas
Uncertainty is an essential part of project management and is inevitable in both projects and organizations. Uncertainty is typically present during the entire lifetime of a project and is constantly changing as the project moves on. Dealing with uncertainty throughout the entire project is paramount in order to achieve the goals set for the project within scope, budget, time and quality constraints. In practice it is nearly impossible to eliminate uncertainty – instead, the goal should be to reduce uncertainty in the different project phases through effective risk management. One of the many different methods that can be of use in this endeavour is a root cause analysis, in which the Fishbone diagram can be utilized.
The Ishikawa diagram, also called Fishbone diagram, is a cause-and-effect tool that can be used to identify possible causes of a problem by looking into the different aspects of a given problem. The major benefit of this method is that it is a structured and organized approach to brainstorming and analyzing possible causes to a problem, which makes it a very valuable tool for not only risk identification, but also risk management in broader view. Besides identifying the risks, the Fishbone diagram can in some cases be utilized to solve problems and eliminate identified risks, which in return reduces the uncertainty in a project. The purpose of this article is to shine light upon the idea behind a Fishbone diagram, when it can be applied, how it can be applied and the practical limitations of the tool.
Contents |
Introduction to uncertainty and risk
In order to fully understand the purpose and use-cases of the Fishbone diagram, it is important to know the importance of uncertainty management in projects, programs or portfolios, and why poor uncertainty management is often detrimental to their success. The article will mostly focus on uncertainty and risk in project management, although many of thoughts, methods and tools can be applied in program and portfolio management. Uncertainty management is sometimes so important that good project management practice can often be thought of as effective uncertainty management[1]. While the two terms uncertainty and risk are often thought to be the same and used interchangeably, they are two different terms[2]. The uncertainty in a project/program/portfolio is defined as relevant information regarding the outcome of a process or decision in the future is either not known, not definite or not reliable[3]. While on the other hand, risk is defined as the outcome or impact of this uncertain outcome [4]. The link between the two terms can be illustrated by saying that uncertainty is the lack of certainty throughout the project/program/portfolio management, and risk is the possible consequence of this uncertainty. Thus, effective risk management is key to effective uncertainty management, which in return is key to a successful project.
There are many ways of dealing with uncertainty, often depending on the type of project/program/portfolio. Most relevant to the Fishbone diagram is risk management and risk identification.
Risk management
Risk management describes the process of identifying, assessing and dealing with risks that occur throughout a project’s lifetime [5]. The aim of the risk management is not to eliminate existing and potential risks, as this is often impossible, but to limit the harmful impact of uncertain events and to reduce the likelihood of these events materializing [6]. As previously mentioned, these risks stem from the inherent uncertainty in the project. It is important to mention that risk management does not equal uncertainty management – instead, risk management is a branch within uncertainty management. The risk management process includes the following four activities [7]:
1. Identifying project risks – both existing and possible risks
The first step of the process is to identify the risks in the project. This is often done by brainstorming across the different stakeholders and by evaluating the components and milestones on a project, in order to identify possible risks. There are also tools that can be used to identify risks, one of which is the Fishbone diagram, which will be mentioned later in the article.
2. Analyzing project risks
After the risks have been identified, they are analyzed in order to both understand the cause(s) and the possible impact of the risk. There are also several tools that can be used in this endeavor, one of which is the Fishbone diagram.
3. Definition and implementation of risk response actions
Once the risks have been analyzed and evaluated, it is necessary to define and implement risk response actions in order to either eliminate or mitigate the negative impact of the risks. Not all risks can be eliminated due to the nature of risks and uncertainty; projects are often complex and consist of many different components resulting in several causes behind an effect instead of one root-cause, which is typically easier to deal with. The complexity of projects combined with the everlasting uncertainty throughout a project’s lifetime makes it difficult to eliminate risks completely. Therefore, the goal is often to mitigate the negative impact of risks instead.
4. Monitoring project risks
The last step is to monitor the project risks, which serves several purposes. First, it is necessary to monitor the risks throughout the entire project’s lifetime, as the risks identified in the previous steps can occur throughout the entire project. Therefore, the risks must be monitored in order to know when to execute the risk response actions determined in step three. Another reason to monitor the project risks is to monitor if the risks evolve. A certain risk that is identified at the start of the project lifecycle may change as the project proceeds and evolve from being a low-threat risk to a high-threat risk.
It is important to note that although the four above activities are to be performed at the very start of the project, they should be repeated throughout the different project phases in the entire project lifetime. Not all risks can be identified at the very start of the project, and in practice projects are often adjusted as they proceed in the phases. A lot of knowledge is also acquired throughout the project, which makes the project team more able to identify risks and deal with uncertainty. Furthermore, already identified risks can be adjusted, as risk response actions can be modified as the project proceeds.
Risk identification
The Fishbone diagram is a versatile tool and can be applied in many ways depending on purpose and context. One of the most common ways of using the Fishbone diagram is however to identify risks primarily, and to aid in the aforementioned four activities in risk management. Risk identification is the first activity in risk management, where the goal is to uncover the certainty in the project by identifying both existing and possible risks. This is an important first step, as it allows the project team to map potential threats to the project, analyze how they can arise, how big of a threat they are and finally, the risk response action, which details how to deal with the threat in the case of it materializing.
The risk identification process can be carried out in many ways, and there is not a fixed method or tool to use. There are many useful tools, one of which is the Fishbone diagram. In regards to risk identification, the Fishbone diagram for a root-cause analysis, which seeks to analyze a given problem and the underlying root-cause [8]. In large-scale and complex projects, it is seldom possible to find one single root-cause due to the complexity of the project, and often there are several causes behind a problem or a challenge.
Application of Fishbone diagram
This section contains a general overview of the Fishbone diagram, followed by a step-by-step guide [9].
Step 1: Identify the problem or challenge
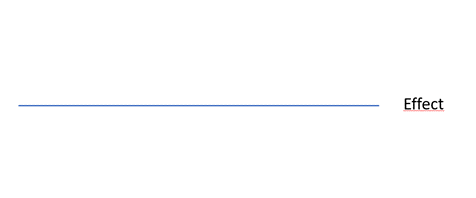
The first step of the Fishbone diagram is to define the problem or challenge that needs to be analyzed. Define the problem as detailed as possible, and when and where it occurs, and where appropriate, list the stakeholders that are involved in the problem. It is important to define the problem correctly, as the entire Fishbone diagram will be based on the problem stated at the very beginning. The Fishbone diagram does not include a native tool to define the problem correctly per se, but other tool such as the CATWOE checklist can help in this endeavor [10]. After the problem has been defined, write it down on a piece of paper, a whiteboard or any other type of canvas. From either the left or the right side of the problem, draw a line horizontally. After the first step, the arrangement should resemble the head and spine of a fish, hence the name Fishbone diagram [11].
Step 2: Identify the main factors
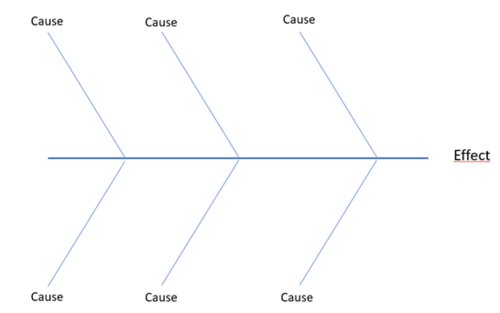
After defining the problem or challenge, the next step is to identify the main factors (in other words, causes) that may be part of the problem or challenge. The idea of this step is to identify as many factors as possible and treat it like a brainstorm. The possible factors do not need to be specific, they can be general. The next steps will dive deeper into these general factors. When the main factors have been identified, draw a straight line off the “spine” of the diagram for each factor [12].
Step 3: Identify possible sub-causes to the main factors
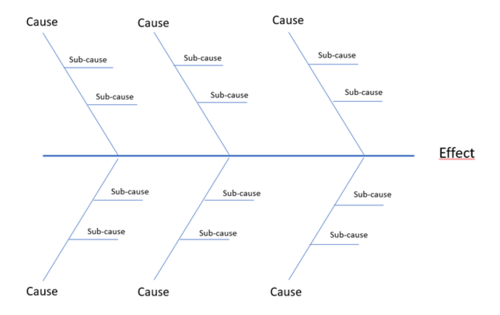
For each of the main factors identified in step 2, it is now time to brainstorm possible sub-causes to the main factors. In other words, the goal of this step is to find possible causes of the problem that may be related to that main factor. Contrary to the previous step, the level of detail in this step is infinite. It is possible to identify causes to sub-causes and so on, and the overall level of detail depends on the complexity of the project first and foremost, but also the satisfaction of the project team. In some cases, a high level of detail is inevitable due to the complexity of the project, and in other cases the project team requires a high level of detail in order to properly identify causes. The sub-causes should be drawn as shorter, horizontal lines coming off the lines drawn in step two. After step two and three, the diagram now resembles a fish with its bones and spine [13].
Step 4: Analyze the Fishbone diagram
The foundation of the Fishbone diagram has now been set and depending on the complexity of the problem or challenge, it is now possible to investigate the different causes listed. Investigating the different causes in order to determine the root-cause(s) can be done in many ways, and may involve surveys, other tools and/or analysis and so on. Based on the steps and this final step in the Fishbone diagram, it should be possible to list the cause(s) for the main problem defined in the beginning.
It is important to note that although procedure of making the Fishbone diagram is in order according to the four steps above, it is often to recommended to go over the steps throughout the making of the Fishbone diagram. For instance, once the sub-causes have been identified in step three, it is sometimes beneficial to go back to step two, as new knowledge has been acquired since performing that step, in which the project team may add new main factors or adjust the main factors identified previously.
General categories
Although the Fishbone diagram is a versatile tool that can be adapted to most projects, program or portfolios independent of industry etc., there are common applications of the Fishbone diagram where the tool is standardized according to the industry and typical use-case. A general template contains six categories [14]:
1. Man
2. Machine
3. Material
4. Method
5. Measurement
6. Environment
7P’s of marketing
The general template is wide and can be used in most cases to a certain extent, as the six categories are almost always relevant. However, there are more narrow, specific use-cases of the Fishbone diagram in for example the marketing industry, where it is possible to adjust the Fishbone diagram to the 7P’s [15]. In this case, the Fishbone diagram would contain these seven main causes [16]:
1. Product
2. Price
3. Place
4. Promotion
5. People
6. Positioning
7. Packaging
The 5S system
Some service industries adjust the Fishbone diagram to include the 5S system typically used in lean production methods [17]. In this application of the Fishbone diagram, it includes the following five main factors:
1. Surroundings
2. Suppliers
3. Systems
4. Skills
5. Safety
Limitations of Fishbone diagram
Albeit the Fishbone diagram is a versatile tool that can be applied in many different contexts, it has some limitiations. First of all, the tool does not have a native way of prioritizing or assessing the possible causes that are listed. This is a limitation, as all the causes look equally important at a first glance. This also makes it more difficult to dive into the Fishbone diagram once it is complete and investigate the different causes. If the tool had a native way of assessing the importance or "likelihood" of each cause, it would be possible to prioritize which possible causes to investigate first.
Another limitation of the Fishbone diagram is that it highly depends on the team developing it. Though the Fishbone diagram provides a framework and a method to root-cause analysis, it does specify how the individual tasks should be carried out, nor does it provide any tool or method to do it. Therefore, a large part of the Fishbone diagram is developed using opinions and experience. The quality, and therefore useability, of the Fishbone diagram depends on the project team. For that reason, it is recommended that the project team consists of experts from atleast each of the focus areas to ensure that the project team does not consist of like-minded people or a team that lacks expertise in certain fields. A diverse team will to a higher degree ensure that possible causes are assessed properly, and will also help in the many brainstorming activities throughout the development of the Fishbone diagram.
Annotated Bibliography
Mind Tools. “Cause and Effect Analysis. Identifying the Likely Causes of Problems
Provides a short and hands-on guide to making the Fishbone diagram.
PMI, The Standard for Risk Management in Portfolios, Programs, and Projects
Although not referenced directly in the article, the PMI standard for risk management is a widely acknowledged standard for risk management in projects, programs and portfolios. The standard details, amongst other things, the core principles, fundamentals and application of risk management principles.
Melanie, K. et al. (2015). “Uncertainty in project phases: A framework for organisational change management”.
The publication provides a great perspective on uncertainty in projects from an organisational change management perspective.
Teller, J. et al. (2014). “Risk Management in Project Portfolios is More than Managing Project Risks: A Contingency Perspective on Risk Management”
The article provieds insights on risk management as a whole, instead of just focusing on project risks. The article is part of the Project Management Journal, backed by the Project Management Institute (PMI).
Mursaleen, Henry Havin (2020). “All You Need To Know About Fishbone Diagram in 2020”
Provides a detailed overview of the Fishbone diagram, covering a lot of material from the history of the diagram to the application of it. In this article the reference was used as it provided a great overview of how the Fishbone diagram is applied in different industries.
Bibliography
- ↑ Atkinson, R. et al. (2006). ”Fundamental uncertainties in projects and the scope of project management”. https://files.transtutors.com/cdn/uploadassignments/2844714_1_ukr1-mgmt-00003-unit03-atkinson-et-al.pdf
- ↑ Melanie, K. et al. (2015). “Uncertainty in project phases: A framework for organisational change management”.
- ↑ Melanie, K. et al. (2015). “Uncertainty in project phases: A framework for organisational change management”.
- ↑ Holton, G. (2004). “Defining risk”. https://www.glynholton.com/wp-content/uploads/papers/risk.pdf
- ↑ Cole, B. (2020). “Risk management”. https://searchcompliance.techtarget.com/definition/risk-management
- ↑ Teller, J. et al. (2014). “Risk Management in Project Portfolios is More than Managing Project Risks: A Contingency Perspective on Risk Management”. https://journals.sagepub.com/doi/pdf/10.1002/pmj.21431
- ↑ Arit, M. (2010). “Portfolio risk management, gamble or safety net?”. https://www.pmi.org/learning/library/portfolio-risk-management-interdependencies-techniques-6578
- ↑ Mind Tools. “Cause and Effect Analysis. Identifying the Likely Causes of Problems”. https://www.mindtools.com/pages/article/newTMC_03.htm
- ↑ Mind Tools. “Cause and Effect Analysis. Identifying the Likely Causes of Problems”. https://www.mindtools.com/pages/article/newTMC_03.htm
- ↑ Mind Tools. “The CATWOE checklist. Developing a Robust Problem Definition”. https://www.mindtools.com/pages/article/newTMC_83.htm
- ↑ Mind Tools. “Cause and Effect Analysis. Identifying the Likely Causes of Problems”. https://www.mindtools.com/pages/article/newTMC_03.htm
- ↑ Mind Tools. “Cause and Effect Analysis. Identifying the Likely Causes of Problems”. https://www.mindtools.com/pages/article/newTMC_03.htm
- ↑ Mind Tools. “Cause and Effect Analysis. Identifying the Likely Causes of Problems”. https://www.mindtools.com/pages/article/newTMC_03.htm
- ↑ Mursaleen, Henry Havin (2020). “All You Need To Know About Fishbone Diagram in 2020”. https://www.henryharvin.com/blog/all-you-need-to-know-about-fishbone-diagram-in-2020/#How_to_Use_a_Fishbone_Diagram
- ↑ Professional Academy. “Marketing Theories – The Marketing Mix – From 4 PS to 7 PS”. https://www.professionalacademy.com/blogs-and-advice/marketing-theories---the-marketing-mix---from-4-p-s-to-7-p-s
- ↑ Mursaleen, Henry Havin (2020). “All You Need To Know About Fishbone Diagram in 2020”. https://www.henryharvin.com/blog/all-you-need-to-know-about-fishbone-diagram-in-2020/#How_to_Use_a_Fishbone_Diagram
- ↑ Lean Sigma Six Definition. “5S”. https://www.leansixsigmadefinition.com/glossary/5s/


