Project Management tool: Gantt Chart
This article is related to Advanced Engineering Project, Program and Portfolio Management course. The aim of the article is the description of the Gantt chart as a tool for Project management, the method, applications, advantages and limitations will be explain.
Contents |
Big idea

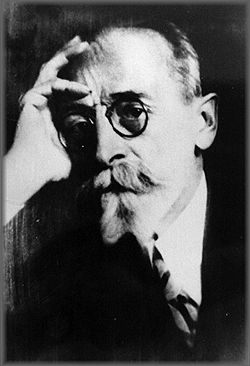
Karol Adamiecki devised the first ‘Gantt’ chart, back in 1896. He was a Polish engineer turned management professor who came up with the idea of displaying processes visually so that he could make it easier to see production schedules – he did most of his work in the steel industry. He called it the harmonogram but he published his articles on it in Polish and Russian, so the English-speaking world didn’t know much about it.
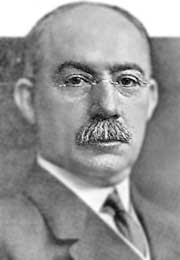
Henry Gantt had the same idea, but about 15 years later. In 1910 Gantt started planning visually with bar charts to allow supervisors in the steel works to see if production was on track or behind schedule. It was Gantt’s name that got attached to this way of planning, but today it’s generally recognized that Adamiecki had the idea first. e.[1]
Concept
To complete a project successfully, you must control a large number of activities, and ensure that they're completed on schedule. If you miss a deadline or finish a task out of sequence, there could be knock-on effects on the rest of the project. It could deliver late as a result, and cost a lot more. That's why it's helpful to be able to see everything that needs to be done, and know, at a glance, when each activity needs to be completed.[2]
Gantt charts convey this information visually. They outline all of the tasks involved in a project, and their order, shown against a timescale. This gives you an instant overview of a project, its associated tasks, and when these need to be finished.[2]
Description
State of the art
Originally Gantt charts were prepared laboriously by hand; each time a project changed it was necessary to amend or redraw the chart and this limited their usefulness, continual change being a feature of most projects. Nowadays, however, with the advent of computers and project management software, Gantt charts can be created, updated and printed easily.
Unfortunately, Gantt charts are more complex than they initially seem. They are inefficient, if hand-drawn — no one wants to keep manually updating a moving chart as tasks are completed — and require skills in resource allocation, task-dependency management, and team collaboration.
Application
Limitations
Bibliography
- ↑ Tell me about Henry Gantt - https://www.projectmanager.com/gantt-chart
- ↑ 2.0 2.1 https://www.mindtools.com/pages/article/newPPM_03.htm
