Key Performance Indicators (KPI)
Contents |
Abstract
Project management is the application of knowledge, tools, skills and techniques to meet project requirements. [1] This article focus on effectively managing different processes during a project by using KPI's to effectively control and monitor "The iron triangle" of projects.
This article will show how KPIs are used in monitoring and controlling processes in projects, but also provide information of what a KPIs is, and how to visualize the data measured in the KPI. The article will focus on KPIs project management such as; Project time, cost and quality management. These subjects will all be analysed using project control with focus on performance measurements, which will result in the creation of KPIs.
Performance measurement is a fundamental principle of management, it is important to measure performance as it identifies the gap between current and desired performance. Managers can use Key Performance Indicators (KPIs) to identify where to take action in order to improve performance. [1]
Key performance management is used to control stage processes in projects, they are used to assign work, monitor work, deal with issues, report progress to the project board and give better insight to take corrective actions. [2]
Using KPIs enables project managers to track progress in a project, giving them a better overview of deadlines, budgets and more, ensuring that the project stays on track.
Definition of a KPI
Controlling time, cost and quality in a project
The purpose of controlling time in a project is to monitor the status of the activities in order to update progress and manage activities in the schedule. The benefit of monotoring processes are that the project manager can recognize deviations in the schedule, and take actions based on this information.
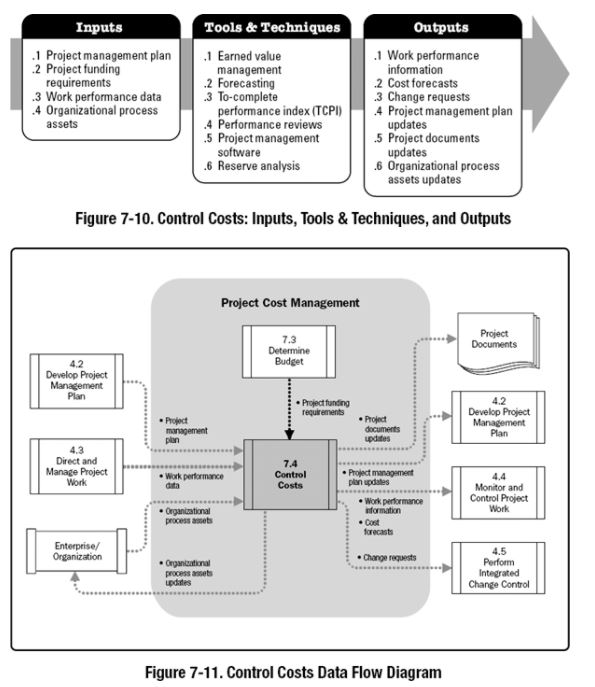
In order to create the KPIs needed to monitor progress, several input factors should be considered:
- Management of the project work
- Project plan
- organisational assets
[1] (Section 7.4)
The KPIs needed for time management in these input factors should include information on the current status of the project, reviews of the current process, time spent in total or by an individual, adjustments to schedule, days spent or cycle times for repeated tasks/activities.
There are various ways of analyzing the different performances in a project, various techniques can be used in order to analyze the inputs:
- Trend analysis
Trend analysis evaluates project performance over time and shows whether performance is increasing or decreasing
A way to measure on trend analysis is through reporting/meetings, where the following questions should provide the necessary insights in the analysis of the project:
- Is the project aligned to its goal?
- Where are we compared to last performance check, did we improve? did we decline?
- Did the project minimize risks?
- Did the project maintain standards in planning and communication?
- Critical path method
If the project isn't progressing along the critical path there is Comparing progress along the critical path determines whether or not the progress of the project adheres to the current end dates in the schedule.
A way to track progress through the critical path is tracking progression with scheduling software, a simple example at how to set up a visual of the CPM is shown below excelPIC
- Earned value management
The earned value management is a method that combines scope, schedule and resources measurements to assess project performance through the following KPIs : Planned Value (PV), Earned Value (EV), Actual Cost (AC), Schedule Varians (SV), Cost Variance (CV), Schedule Performance Index (SPI) and Cost performance index (CPI). These KPIs show performances on cost, performance and time spent
- Planned Value (PV)
is the budget allocated to the physical work that needs to be accomplished for an activity or WBS component in the schedule. PV is often referred to as the Performance measurement baseline (PMB). The sum of each PV is also called the Budget at Completion (BAC)
- Earned Value (EV)
Measures work performed in terms of budget allocated to the scheduled work at the completion. EV is measured when comparing the value to PMB, the EV cannot be greater than the PV. EV is used to measure the progress of the work, and should be measured on each component in a project. EV can be used to monitor single projects, or be cumulative to determine long-term performance
- Actual Cost (AC)
Actual cost is the realized cost for work performed on an activity or WBS, and is basically the amount of money spent during any point of time in an activity.
- Schedule Variance (SV)
Schedule variance is a measure of performance indicated by EV and PV. Schedule variance is given by SV = EV - PV. Schedule variance is a measurement showing if a project is ahead or behind schedule and can be used at any point during the project.
- Cost Variance (CV)
Cost variance is the amount of deficit or surplus at any point during a project and display the cost performance. CV indicates physical performance to cost spent. CV = EV - AC
- Schedule performance index (SPI)
SPI is a measure of schedule efficiency as the ratio of earned value to planned value, SPI shows how time efficient the project is, an SPI < 1 means less work was completed than planned, and an SPI > 1 means more work was completed than planned. SPI = EV/PV
- Cost performance index (CPI)
CPI measures cost efficiency of budgeted resources expressed through the ratio of EV to AC. A CPI < 1 imply that there is a cost overrun, a CPI > 1 means a cost overrun. CPI = EV/AC
(PMBOK 7.4.2.1 & 7.4)
Knowing the current performance is needed when a project manager has to update the schedule
PMBOK link for writing [3]
Project Quality Management
Work in progress
PMBOK link [4]
References
- ↑ 1.0 1.1 A Guide to the Project Management Body of Knowledge. http://proquestcombo.safaribooksonline.com.proxy.findit.dtu.dk/9781935589679/chap3_xhtml
