Scheduling techniques in Project Management
Developed by Jessica Linda Ruina
“The Project Management is a management system that aims to results”.[1] The goal of a project can only be reached through precise scheduling techniques that take into account all various constraints such as time and economic resources. Techniques such as PERT (Program Evaluation and Review Technique), CPM (Critical Path Method) and GANTT are the most used to plan into details a project, prevent uncertainties and avoid risk. These three techniques complete each other and offer a wide range of scenarios that could occur during the development of a project.
The aim of scheduling techniques is to reach the goal on time without wasting precious and limited resources. On the other hand it’s an important tool to prevent in advance future situations and to promptly identify future issues that can compromise the success of the project.
Thought the use of these techniques all the single steps of a project are defined in advance, the goals are clear and the resources are properly allocated.
The three scheduling techniques that are going to be explained in this articles are PERT, CPM and Gantt. Both three help planners, managers and stakeholders to visualise the development of projects into details and steps. PERT, is useful to observe the dependencies of the various activities but it's complicate to use it for projects that have a large amount of activities and links. An important tool, mostly used together with PERT is CPM that selects the activities that are mainly critical: their delays affect the deadline of the whole project. The last tool is going to be presented is Gantt, a really simple linear visualisation of the time trend of projects that however doesn't show any dependencies between the activities.
Contents |
Introduction to the Project Management
“A project is a sequence of unique, complex and connected activities that have one goal or purpose and that must be completed by a specific time, within a budget and according to specification.” [2]
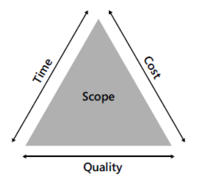
Every project has therefore constraints that can be summed up into the Project Management Triangle of Figure 1. The most important interlinked constraints of a project are: time, cost and quality. Figure 1 shows that the value of two constraints determine the third one. For example, you can build a house quickly with a really high quality but it will cost heaps. On the other hand, you can choose to save up and reduce costs and build it in short time but the quality won’t be excellent. Through this example, it can be understood that projects has to deal with limitations and with compromises. Managing and supervising a project is not an easy job and its management is the crucial issue. "The Project Management is the application of knowledge, attitudes, techniques and tools to the activities that form a project to reach successfully the goals." [3]
According to the PMI® - Project Management Institute there are five steps (Figure 2) to determine the entire managing flow of the process from the beginning to the end:
- 1. Scoping
- 2. Planning
- 3. Executing
- 4. Controlling
- 5. Closing
Five Steps in Project Management
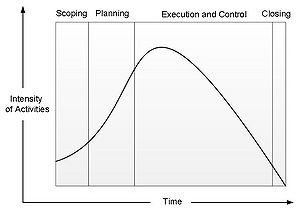
- Scoping
This phase answers the question: “What shall be done?”. First of all the output of the project has to be something that reflect the needs of a specific target costumers. Afterwards the draft of the scope it’s necessary to make sure that all the needed resources are on board to start with the project.
- Planning
The question for this step is “How are we going to do it?”. It’s crucial to define all the activities that must be done for the project. A valuable tool to do this is the WBS (Work Breakdown Structure). Defining the people, creating the project team, estimating costs and time is the heart of the Project Management. PERT (program (or project) evaluation and review technique) and Gantt Diagram are two important tools to analyze into details each step of the project to find out the time to reach its conclusion.
- Executing and controlling
These are two phases that can be run simultaneously: the first one refers to the execution of the planned work whereas the second one checks if the actual development of the work is on line with the planned one. If there are gaps between these latest there must be additional planifications. This big step is extremely important because it covers the launch of the project till its end.
- Closing:
It includes all the necessary activities for the closure of the project. Here the question could be: “How well did the project go?”. At this step it’s important to analyze the acceptance of the good/service from the customers, to investigate how was the management of the project, its pros and cons and some possible improvements. The lasts thing that belongs to this phase is the communication to all the stakeholders about the conclusion of the project and the reached goals.
The step is going to be analyzed in this article is the Planning. Scheduling techniques are extremely important to plan into details how the project is going to be developed. It’s nearly impossible to make decisions about a project without any scheduling tools. They are fundamental to avoid as much as possible risk and uncertainty. They are really helpful to have a wide view of all the different scenarios that could occur.
PERT (Program Evaluation and Review Technique)
PERT (Program Evaluation and Review Technique) is a graphical scheduling tools to show the project’s timeline. It was first developed by the United States Navy for the Polaris submarine missile program in the 1950s. Through the use of PERT the Project was finished 2 years in advance and this showed the importance of this scheduling technique. Afterwards it kept on being used in other fields thanks to its excellent productiveness. PERT started being used in the army industries, governmental institutions and private industries. Only during the 60s this technique became public and started spreading in various fields. [4] Through PERT is possible to keep under control the project’s activities using the visual representation that keeps in mind the interdependencies among the activities that are necessary to the conclusion of the project. This tool doesn’t schedule the activities (as Gantt diagram) because the activities are considered with unlimited availability. In this context activities have only independencies and this means that some of them can only come after the completion of others. PERT is one tool that saves up in average 20% of the duration of the project as well as its cost. [4]
The PERT diagram is formed by:
- Activities: they represent the tasks to be completed. They should include a description and the expected duration. The key activities that are essential for the project and that can be considered as intermediate finish line are named milestone.
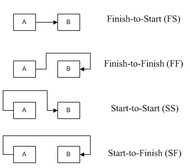
- Connections (or constraints): they show the existing relation between the activities that can be FINISH-START, FINISH-FINISH, START-START and START-FINISH (Figure 3).
- FINISH-TO-START: the start of the successor task depends upon the completion of the processor’s work.
- FINISH-TO-FINISH: the completion of the next task depends upon the completion of the predecessor’s task.
- START-TO-START: the start of the successor task depends upon the initiation of the processor’s work.
- START-TO-FINISH: the completion of the next task depends upon the start of the predecessor’s task.
- Preset Date: Some activities can have a significant impact on the critical path and their deadline becomes a sort of constraint. For this reason some of them have a prefixed date and cannot be run before that date or not after that date and so on.
- Calendar: PERT diagram needs to specify working ways, weekend days, holidays and so on to calculate in the exact timetable.
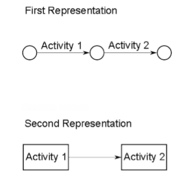
There are two ways of representing PERT (Figure 4):
The first method AOA (activity on arrow) represents the activities through arrows and the starting event and the end event are represented by the nodes. This was the first representation of PERT and it shows exactly the network but it’s difficult to use because it implies the use of “fake” activities to be able to show all the links between the various activities.
The second method AON (activity on node) to represent PERT uses rectangles to show the activities and the constraints between the activites are shown by arrows. This system is easier and is called “Precedence representation” . Through this representation is possible to show all the constraints without adding extra “fake” activities.
In PERT diagram is fundamental to calculate the times for each activity that are going to be calculated through two steps, one onward and the other one backward.
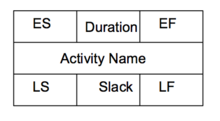
After is known the network between the activities and their duration, the PERT diagram can be started. The times that are going to be calculated are:
The early start time (ES)
The early finish time (EF)
The late start time (LS)
The late finish time (LF)
Time estimations
So far in PERT was used a fixed time for each activities. In reality it is more realistic to have three different time estimations such as optimistic time (O), Medium time (M) and Pessimistic Time (P). Through this it is possible to calculate the expected time (TE) for each activity.
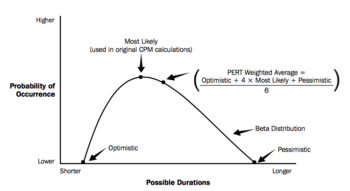
The best way to represent PERT is the BETA distribution, seen on Figure 5, that is a smooth curve. It uses three parameters that in this context are Optimistic time, Medium time and Pessimistic time. The peak on top of the graph is the most accurate estimation of the duration of the project. Calculating the Time Estimation (TE) for the various activities is an interesting way to have a more precise idea of the credible duration of the project. In addition to this, it is interesting to calculate the variance of each task. Through the variance it's possible to calculate the standard deviation (square root of the variance) to identify how much the project could be postponed or anticipated according to the esteem.
| Activity | Optimal Time (weeks) | Medium Time (weeks) | Pessimistic Time (weeks) | Estimated Time (weeks) | Variance (weeks) |
|---|---|---|---|---|---|
| A | 1 | 2 | 3 | 2 | 0.11 |
| B | 2 | 3 | 4 | 3 | 0.11 |
| C | 1 | 2 | 3 | 2 | 0.11 |
| D | 2 | 4 | 6 | 4 | 0.44 |
| E | 1 | 4 | 7 | 4 | 1 |
| F | 1 | 2 | 9 | 3 | 1.78 |
| G | 3 | 4 | 11 | 5 | 1.78 |
| H | 1 | 2 | 3 | 2 | 0.11 |
If for example the Critical Path is A-C-E-G-H it can be calculated its cumulative variance.
This means that the project could finish earlier or later than the expected day. The delay or the advance should stay within 1.78 weeks according to the esteem.
Step by step to construct a PERT Diagram
- STEP 1 – Arranging the activities
Arranging the network of the various activities and entering the Activity Name and Duration.
- STEP 2 – Going onward (from the start to the end)
Calculate the Early Start (ES) and Early Finish (EF) of every activity. The last activity, through its EF, will show the total duration of the project. The first activity will have 0 as ES and EF as its duration. The next activity will have ES as the previous activity’s EF. In case one activities has more than one previous activity who’s dependent with, its ES is the latest EF. It makes sense because this activity cannot start before the previous ones are finished.
- STEP 3 – Going backward (from the end to the start)
This step is fundamental to see if there’s some possible slacks without delaying the whole project and which is the critical path. The last activity has LF=EF and LS=ES. The previous activity have LF as the next activity LS. In case an activity has more than one following activities the LF has to be taken is the worst (higher). LS is then calculated as LF – duration.
- STEP 4 – Calculating the slack
Once all the ES,EF,LS,LF are completed it could be calculated the Slack. Slack = LS – ES = LF – EF In case the slack is more than 0 it means that that activity can be delayed the amount of time of the slack without delaying the whole project. If the slack is equal to zero it means that that’s a critical activity that if is delayed the whole project will be done after the deadline.
CPM (Critical Path Method)
The CPM was created in 1957 from the DuPunt Company to have a specific scheduling tool able to improve the planning and the development of projects[6]. It's a technique that is used to identify, within a network of activities, the activities that are critical for the completion of the project. In other words the critical activities are the ones that if delayed, they delay the whole project.
CRITICAL ACTIVITY has SLACK=O
The goal of the CPM is to optimize the tradeoff between time (project length) and costs. It identifies the point where the costs are minimal according to the optimal time. This technique was used in the chemical factory of Louisville, Kentucky, and the time was reduced by 37%. This big success of CPM started spreading this technique in various field and in the whole economic world.
To create a CPM diagram the following elements are needed:
- List of the activities that are needed to complete the project
- Duration of each activity
- Dependencies between the activities.
As it can be noticed the same elements are needed to create PERT. For this reason most of the time, both PERT and CPM are created simultaneously. Indeed most of the time the use of both tools is called PERT/CPM.
Trade off between costs and time
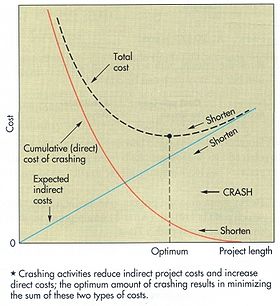
Figure 6 shows the tradeoff graph between costs and time. If the project has to be completed in a really short time the total cost (dotted line) is extremely high whereas if there is more time to finish the project the cost decreases (see dotted line). On the other hand if the project delays and for example it finished afterwards the deadline there are going to be penalties. Indeed the total cost line increases again. The dotted line is the sum of direct costs and indirect costs.
TOTAL COST = DIRECT COSTS + INDIRECT COSTS
Direct costs are all the expenses for the activities directly connected to the project[8]. Some examples of direct costs are:
- Employees and workers salaries that work within the project
- Materials
- Outsourcing activities
- Software
- Machineries
Indirect costs are the expensed for the activities that sustain the project and are essential for its development. Some examples of indirect costs are:
- Salaries of the administration employees
- Salary of Top Management
- Costs of commercial activities
To sum up CPM is extremely important to understand the strong link between costs and time. Through this tool is possible to prevent extra crashing costs due to delays and to estimate the most realistic length of a project.
The estimated time length of the project (as showed above) is: estimated deadline +/- Standard Deviation of the Critical Path.
Example of PERT/CPM
| Activity | Predecessor | Duration (weeks) |
|---|---|---|
| A | / | 5 |
| B | / | 4 |
| C | A | 3 |
| D | A | 4 |
| E | A | 6 |
| F | B, C | 4 |
| G | D | 5 |
| H | D, E | 6 |
| I | F | 6 |
| J | H,G | 4 |
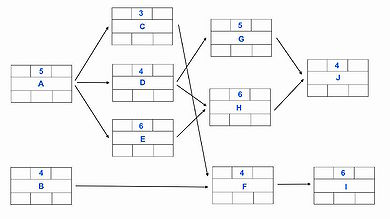
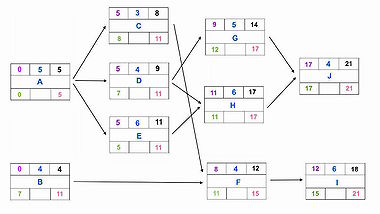
STEP 1 – Arranging the activities The table above shows the dependencies of the various activities. Activity after activity, starting from activity A, the network of the whole project can be created as Figure 8 shows.
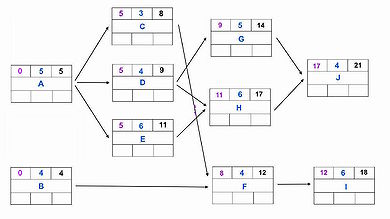
STEP 2 – Calculating ES and EF Once the network is created, it's possible to calculate Early Start (ES) and Early Finish (EF) of every activity. Activity A and B, that are the two activities that start the project have ES=0. Then EF can be calculated as EF=ES+DURATION. At this point it is possible to determine ES and EF for the next activities that depends from A and B such as C,D,E (for A) and F (for B). Their ES=EF(of the previous activity). This process has to be repeated till the end of the project (activity J).
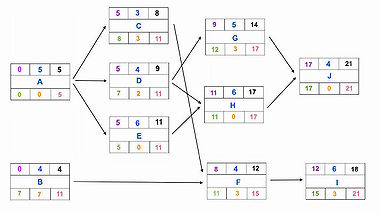
STEP 3 – Calculating LS and LF Going backward from J to A it can be calculated the Late Start (LS) and Late Finish (LF). As it can be seen in Figure 10, J is the last activity that end. This activity determines LF 21 for both of activity J and I. Task I has no following activities and therefore its LF= LF of J. Then LS can be calculated as LS=LF-DURATION. Going backward the activities connected to J and I are H and G (for J) and F (for I). Their LF=LS of the activities they are connected with.
STEP 4 – Calculating the slack Once all the ES,EF,LS,LF are completed it could be calculated the Slack. Slack = LS – ES = LF – EF.
Figure 12 shows step by step how to calculate ES, EF, LS, LF and Slack.
Gantt Chart
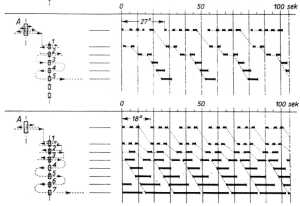
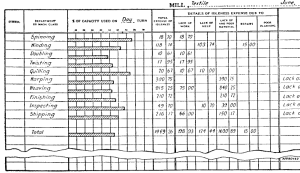
The Gantt Bar Chart, that is in use nowadays, was developed by Henry Gantt (American mechanical engineer and management consultant) in 1910's to display graphically the process of a project [10]. Before him, during the 1890s, a Polish engineer named Karol Adamiecki, already used a sort of Gantt chart for the steelworks he was running. But as it can be noticed from the Figure 13, his Chart was pretty basic and rough than the one developed by Gantt (Figure 14). [10].
Henry Gantt was then the one who elaborated the actual chart that is currently on use. His diagram is a tool that belongs to the network scheduling technique and it shows the various activities and their time on the Cartesian axis. The vertical axis represents the activities whereas the horizontal one shows the time.
Gantt is one of the most used scheduling tool both for the operational and controlling phases. It can be represented by itself otherwise it suits well together with the PERT Diagram. In the Gantt chart the correlations of the various activities aren't showed: however it is possible to figure out when the activities are scheduled (starting date and end date) but it is not possible to see from which activities one task depends on or which is the input for one activity. For this reason it is recommended to use Gantt Chart with PERT to have a wider prospective of the whole project. Gantt is a really powerful tool to supervise the project and evaluating its development in relation to the time of each task.
Input for Gantt Chart
To create the Gantt Chart only four elements are needed [11]:
- Project Scope
- Responsibilities
- Available Resources
- Schedule Management System
- Activities, their timing and sequences
Analysing the scope of the project helps the stakeholders and schedulers to understand better the activities that are going to be done. Every activity has a responsible that takes care of its development and progress. It's fundamental to involve these people in the scheduling process because they are in the best position to know about the needed sources, timings and the knowledge to prevent possible bottlenecks. In addition to this it is essential to set up a sort of scheduling management system. For example: "Which scheduling techniques are needed?","How are they going to be used?", "Which tool is more appropriate to use?". All these questions are the basic ones to create a scheduling management system.
It is important to know really well every activity to have a detailed vision of the whole project.
Creating a Gantt Chart
- AXES
The first thing that is needed to create the Gantt Chart is a sheet with horizontal timescale and the activities on the vertical axis. It is useful to add a calendar timing for the various activities to have an idea of the needed timescale. To have a little bit of margin for extra activities or mistakes it is recommended to always add spare time. This is also useful to have a clearer vision.
- DRAWING BARRES
Every activity is represented by a bar and its length is proportional to its duration. Sometimes some activities can be split into several steps as Figure 16 shows. It's important to represent the various barres underneath the main activity bar called hammock activity[11]. This way it will be easier to follow the development of the project and identify delays. Managers need to have a big-picture of the whole project and having a hammocks' summary is extremely useful for this purpose.
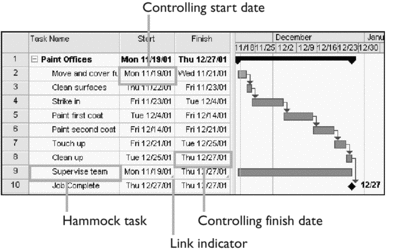
Every bar has to be placed according to its sequence. If task B is after A and before C, its bar has to be between the other two. Even if on the chart aren't represented the connection between the activities it is essential to follow their network.
- ARE ALL ACTIVITIES NECESSARY?
After the whole chart is done, it is necessary to check if all the activities listed in the Gantt chart are necessary. If some are useless it's better to delete them.
Example of Gantt Chart
| Activity | Predecessor | Duration (weeks) |
|---|---|---|
| A | / | 5 |
| B | / | 4 |
| C | A | 3 |
| D | A | 4 |
| E | A | 6 |
| F | B, C | 4 |
| G | D | 5 |
| H | D, E | 6 |
| I | F | 6 |
| J | H,G | 4 |
- STEP 1: Create the top scale according to the data or the activities duration.
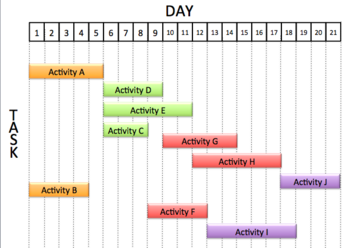
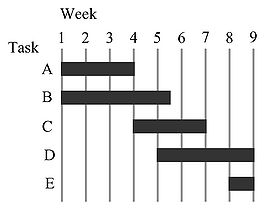
- STEP 2: At this point the dependencies of the activities have to be analysed. Task A and B don't have any predecessor and they can be the first two activities who the Gantt Chart starts with. It's important to create every rectangle as long as the task's duration.
- STEP 3: The next step is looking at next activities that have as predecessors the activities already on the map. After A and B, it can be seen from the table that activities C,D,E and F are connected to them. At this point put on the map the new activities with their starting point afterwards the end of the previous activities.
It can be noticed on the map of Figure 17 that four bundles of activities can be selected according to their dependencies. For this reason they are coloured with different colours.
Differences between PERT, Gantt and CPM
| PROS | CONS | |
|---|---|---|
| PERT [13] |
|
|
| Gantt [14] |
|
|
| CPM [13] |
|
|
Benefits of using scheduling techniques in Project Management
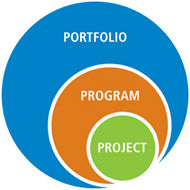
Scheduling techniques in Project Management are fundamental to deliver projects on time. Delays or failures do not only affect the project by itself but affect the structure where the Project Management belongs to. To have a clear idea of the differences between Project, Program and Portfolio, their definitions according PMI® are given.
- Project: "A temporary endeavor undertaken to create a unique product, service or result."[3]
- Program: "A group of related projects managed in a coordinated way to obtain benefits and control not available from managing them individually. Programs may include elements of related work outside of the scope of discrete projects in the program."[3]
- Portfolio: "A collection of projects or programs and other work that are grouped together to facilitate effective management of that work to meet strategic business objectives. The projects or programs of the portfolio may not necessarily be interdependent or directly related."[3]
These three categories are interconnected and if one of these collapses, the others are going to be affected. If the life cycle of a project extends, it will alter both program and portfolio schedule.
Benefits on the project level
Managing efficiently and effectively a project means taking advantage of scheduling tools and techniques to use resources optimally. Even if different projects aren't linked one each other, their outcome is mostly the input of programs. Projects are the foundations of both programs and portfolios and for this reason they retain a big responsibility. Their delays or resources allocation affects the whole complex system. It's fundamental to use scheduling techniques to reduces as much as possible their impact on a bigger scale.
Benefits on the program level
A program is, by its definition, a bundle of projects that run simultaneously. Managing various projects at the same time isn't an easy job, an for this reason scheduling techniques are always used to control the development of the program. Within a program it's really useful to use scheduling techniques to visualise which projects are running well and sometimes better than the expected while others have delays and difficulties to proceed. Through the use of scheduling techniques it's possible to move resources between among various project to optimise their development.
Benefits on the portfolio level
At this point it's fundamental to bear in mind that usually portfolios keep running during the whole life of the company. They usually don't have a deadline but in some cases there are temporary ones who have to be scheduled and delivered on time. These type of portfolio runs only in a specific lapse of time. The fashion industry, for example, each season has one portfolio that is going to end the following months.
Deadlines and time limits are the most important constraints that affect the reputation of a company. Delivering on time project, product or services means being reliable and experienced. Delays or failure can always happen but through detailed scheduling techniques it's possible to prevent and manage them. Promising to customers the delivery of the project at a specific date and then not being able to commit it is synonymous of unreliability and lack of scheduling tools. Consequences will be penalties, loss of customers as well as incomes.
To sum up, the previous scheduling techniques, are the most used and applied in Project Management. They are the base for a successful development of the project.
References
- ↑ Miscia S., 1994, Il Project Management, Quaderni di Formazione Pirelli, Milano.
- ↑ 2.0 2.1 Robert K. Wysocki, 2009, Effective Project Management: Traditional, Agile, Extreme. Fifth Edition. Indianapolis. [Available online on Google books pag.6]
- ↑ 3.0 3.1 3.2 3.3 3.4 3.5 Project Management Institute®, 2000, A guide to the Project Management body of knowledge. Pennsylvania. [Available online]
- ↑ 4.0 4.1 Booz, Allen & Hamilton, 1963, PERT Planning and Control Procedures: Deere & Company, Moline, Illinois.
- ↑ Mohammed Mawlana, Construction Engineering and Management Blog, 2011. [Accessed on 13 September 2015] [Available online]
- ↑ Gail Thornley, 2001, Critical Path Analysis in Practice: Collected papers on project control, Oxon. [Available online on Google books pag. 3]
- ↑ Y. Chen, Project Management. [Accessed on 22 September 2015] [Available online]
- ↑ Giovanni Macchia, 2009, Project management. Teoria strumenti attività. [Available online on Google books pag.135]
- ↑ 9.0 9.1 Manageitup!, Karol Adamiecki vs. Henry Gantt, 2009. [Accessed on 22 September 2015] [Available online]
- ↑ 10.0 10.1 10.2 Andrew J. DuBrin, 2011, Essentials of Management, 9th Edition, South-Western College Pub [Available online on Google books pag.201]
- ↑ 11.0 11.1 Dragan Z. Milosevic, 2003, Project Management ToolBox: Tools and Techniques for the Practicing Project Manager [Available online on Google books pag.173]
- ↑ Bonnie Biafore, Troubleshooting Microsoft® Project 2002, 2002.
- ↑ 13.0 13.1 Craig Borysowich, Feb 2, 2008, Pros & Cons of PERT/CPM. [Available online]
- ↑ Craig Borysowich, Feb 2, 2008, Pros & Cons of Gantt Charts. [Available online]
- ↑ Andy Jordan, Project Management, 2014. [Accessed on 20 September 2015]. [Available online]
Annotated Bibliography
Robert K. Wysocki, Effective Project Management: Traditional, Agile, Extreme. This book gives a comprehensive overview of all the best management approaches and tools that are mostly used nowadays. Through its 200 pages it shows traditional, agile and extreme ways to handle projects. It's really easy to read thanks to its step-by-step instruction and practical case studies. It shows which tool is better to use and how to better achieve better outcomes.
Project Management Institute®, 2000, A guide to the Project Management body of knowledge. The guide describes guidelines, rules and characteristics for project, program and portfolio management. These standards it explains are widely accepted and stakeholders organisations to achieve professional excellence. It dentifies and describes the subset of principles and practices that most projects use. It's useful to learn the common lexicon. It also explains the major concepts behind the project management.
Booz, Allen & Hamilton, 1963, PERT Planning and Control Procedures: Deere & Company, Moline. This edition focuses on PERT scheduling techniques. It describes into detailed how it was born, its development and all its pros and cons. It's extremely useful thanks various explained examples and different scenarios where PERT can be used. In addition to this it shows how to use this scheduling technique to control the development of projects.
Gail Thornley, 2001, Critical Path Analysis in Practice: Collected papers on project control, Oxon. This collection of papers explains what is the Critical Path Method and shows how it can be used in Project Management. It goes through the various way to use it and how it can be used to control the development of projects.
Giovanni Macchia, 2009, Project management. Teoria strumenti attività. This Italian book describes the theory and the processes of project management, focusing on basic definitions but also introducing new ones. It dedicates an entire chapter to analyse each step of the project, illustrating the tools and the processes that occur in each phase. It also explains how to handle stakeholder and how to include the in the project's planning and control. In the last part it deals with the economic part and the costs and budget management.
Andrew J. DuBrin, 2011, Essentials of Management, 9th Edition, South-Western College Pub. Focus on the main principles and practices of effective management. It explains the most important successful tools in today's businesses. This book offer a great introduction for new managers to understand the core concepts. It also contains various researches and application of scheduling techniques. In the middle part it refers to the important role that the environment plays in a company. The latest information technology, and decision making are also included.
Dragan Z. Milosevic, 2003, Project Management ToolBox: Tools and Techniques for the Practicing Project Manager. Provides an interesting and unusual look at the situational framework used in building a project management toolbox. It shows real-world examples of toolboxes among which there is PERT, GANTT and CPM.
Craig Borysowich, Feb 2, 2008, Pros & Cons of PERT/CPM. This short guide, made by Craig Borysowich (ten years experience in Project Leadership roles), explains in a brief and concise way the pros and cons of both PERT and CPM.
Craig Borysowich, Feb 2, 2008, Pros & Cons of Gantt Charts. This short guide, made by Craig Borysowich (ten years experience in Project Leadership roles), explains in a brief and concise way the pros and cons of Gantt Chart.
