Agile One Page Project Management
Contents |
Abstract
In this article the Agile One Page Project Management will be described and reflected on. The article will start with a description on the One Page Project Management (OPPM), what it can be used for and why it’s good. It will be defined what the 5 different features behind the OPPM is. Afterwards the Agile Project Management will be described and a fit between the agile project management and OPPM will be made.
In the next section it will be described how the OPPM can be created in the 12 different step the agile OPPM consist of. It will also be described how the tool can be maintained in 7 different steps throughout the progress of the project.
Furthermore, the pros and cons of the OPPM will described, and a similarity measurement for both PMBOK and PRINCE2 to the OPPM will be made.
Lastly a discussion on how the OPPM is used in a pharmaceutical company, and another one-page tool will be described.
Big Idea

What is good project management? Some will say that good project management is one who gets the project done on time and on budget and has the ability to communicate project performance (scopes, timeliness and planned versus actual resources) and expectations to the team members and stakeholders. To do a project well, a project manager is necessary. But the project manager cannot do everything on their own, he or she needs to have corporation from the team. To get the team onboard and understanding the project different aspect from the start different tools can be used. One of these tools is the; One Page Project Management (OPPM). OPPM is a visualization tool on one single page (FIGURE XX). The OPPM helps the project manager communicate sufficiently to the team, so the project gets tangible for everyone. The OPPM is also an advantage when keeping different stakeholders informed, because the tool is easy to understand and because it can be maintained through the progress of the project.
The OPPM tool have 5 useful features;
- Use of the five essential parts of a project (tasks, objectives, timeline, cost and owners) plus risk and quality
- The linkages and alignment of each in statement 1.
- A clear, efficient and accurate description of both plan and performance
- A helping tool to the project manager rather than a replacement
- An intuitive graphic that is easy to use and maintain.
The OPPM can easily be aligned with the agile project management. The key concept behind the agile project management is that the work and responsibilities is divided into 3 different roles; the project owner, the Scrum Master and the team members. The project owner organizes and handles the goals, tradeoff of schedule and scope and adapting to change the project requirements and priorities. The Scrum Master guides the team, so they know how to prioritize their tasks. The team member handles most of the tasks, progress reporting and make the quality control for the product.[2]
Another important and special feature of the agile project management is the different sprints which defines the project. Each sprint has a defined goal, which has to be reached, and the length of these is often between two to four weeks. After each sprint the team members, scrum master and project owner will meet to get an overview of how well the project goes along. [3]
Agile One-Page Project Management

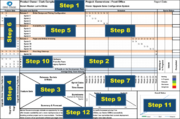
The agile OPPM can be seen at figure XX. In the agile OPPM there are 12 different steps which needs to be considered and initiated to get the best representation of the OPPM.
Step 1, The Header. Here the user needs to provide the name of the project, the product owner, the scrum master, the vision of the project and the report date, which is when the OPPM is made.
Step 2, Development Team. The Development Team step is where the team is made. The optimal size of a team is between five and nine people. It is important to notice that in the agile team the teams are often smaller and work closely together, compared with traditional project teams. The different team members need sufficient skills to accomplish the tasks.
Step 3, The Matrix. Here all the hub of the OPPM is made and all points meet. At this step the project owner will gather the scrum master and team members together to discuss how the project should be handled. In this step it is important for the product owner and the scrum master to get the team to master and fulfill agile product management.
Step 4 Feature Sets. Feature Sets finds the most important features which provides business value, together with the customer. In agile OPPM there will be many features and therefore it is recommended to group them into different umbrella groups with similarities, so they can fit the OPPM.
Step 5 Releases and Sprints. Releases and Sprints defines and planes the baseline of prioritization. The development hours are highly important to consider here. The product owner decides when the sprints are released. The product owner needs to make a hierarchy for the different sprints so they build iteratively on the previous one. In each release there can be 4-12 different sprints.
Step 6 Aligning Sprints with Feature Sets. Aligning Sprints with Feature Sets it a high-level planning result, that shows which features are going to be captured in each sprint. In agile is it central to plan, and to adjust the plan along the way.
Step 7 Sprint Dates and Time Boxes. Sprint Dates and Time Boxes, here the released and individually sprints are given a time period, which also mean that the hole project is given an end date.
Step 8 The Schedule. Here the releases and sprints are aligned with the time boxes. This gives the product owner, scrum master, team members and stakeholder a precise idea on how the project will go along.
Step 9 Backlog Burndown. Backlog Burndown is a graphical display of the development process for each spring, where the progress can be measured over time. The burndown chart shows the progress from the previously sprint and the current sprint. The burndown chart could also be shown for the release instead.
Step 10 Risk, Qualitatives and Other Metrics. Risk, Qualitatives and Other Metrics is a subjective or qualitative step of the project. Meaning, the features needs to align with different levels of risk. “A” is a major risk, “B” is a minor risk, “C” can be another more capturable risk and “D” is the client and sales teams’ satisfaction.
Step 11 Overall Status. Overall Status gives senior management and other stakeholder a status report on how the project is going. On the graph there are 2 lines, a solid and a dotted line. The solid line shows the adequate performance and is usually 10 percent under the expectation, while the dotted line shows the ideal progress and is normally 10 percent better than the expectation. So if the project is in between these two lines the performance of the project is as expected.
Step 12 Summary & Forecast. Summary & Forecast is the last step in filling out the agile OPPM. At this step the readers will be informed about the project status and what the future steps will be. As seen this step does not have much space, this is on purpose. The project can better and more accurately be described by a graphic instead of words.
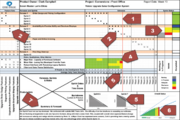
One can now see on the figure that is it nearly filled out. The rest of the boxes which is not filled out, is used to maintain the OPPM. More generally speaking there is seven reporting steps to maintain through the progress of the project.
Maintenance
Step 1, at arrow 1, one needs to place a vertical red line, here shown between week 13 and 14, to show the current time. When doing this the reader of the OPPM, gets a quick view on timeline. In step 1, one also needs to fill in the report date, which is placed in the upper right corner.
Step 2, at arrow 2, is where you fill out the dots. These dots explain how the different sprints are completed. As it can be seen from Figure XX, the team is finished with the first release and is ongoing with release 2. Release 3 hasn’t started yet, which can be seen from the unfilled, but also from the timeline, which state that release 3 will first start in week 17.
Step 3, at arrow 3, is how well it is going with the different sprints. At this step the OPPM uses colors to describe the improvement. If the box is green it means that the sprint was adequate, if the box is gray is means that the sprint is backlog, blue means that it is in progress, yellow means worrisome, which means there is an issue in the project, and red means dangerous. A closer look at figure xx, at arrow 3, will also show the 3 different columns; a Backlog and in progress column, an Issues column and a completed column. With these 3 columns OPPM can more precisely define the process of the sprints. In the first release is can be seen that this was delivered in time and if we look at the sprints it can be seen that it was successful, and the customers were satisfied with the result.
Step 4, at arrow 4, also uses the color code, described in step 3. At this step the purpose is to maintain and handle the Risk, Qualitatives and Other Metrics on the time of the project. Meaning it follows the red line drawn in step 1.
Step 5, at arrows 5, here the top arrow describes the Average Daily Team Velocity, which means the work the team members can put in the project. The number is found by counting the number of units of work completed during a specified time period. In this step the OPPM also require the number of people on the development team, which at this current time is 6 people. The bottom arrow shows 2 graphs, the burndown chart, that indicate the previous sprint and the current sprint. The curve shown, day by day, the time spend and the time left of the sprint according to the work left.
Step 6, at arrow 6, once again uses the color codes described in step 3. At this step the OPPM describe the overall status of the project. Looking at the graph it can be seen from the green colors that the first 10 weeks was progressed at least adequately, week 11 and 12 are yellow which means that the project has had some issues, and week 13 is red, which indicates a period with severe struggles. The curves in the other hand shown that the project is in perfect condition, which is indicated by the bars being in between the two lines.
Step 7, at arrow 7, a written description of the summery and forecast is made. Here the purpose is to explain why things are happening and what will be done to improve the progress of the project.
Limitations
Industrial use
Annotated bibliography
- ↑ Campbell, C. A. (2012) The New One-Page Project Manager: Communicate and Manage Any Project with a Single Sheet of Paper. Hoboken, N.J.: John Wiley and Sons
- ↑ https://www.versionone.com/agile-project-management/
- ↑ https://www.sinnaps.com/en/project-management-blog/agile-project-management-sprint-methodology
- ↑ Campbell, C. A. (2012) The New One-Page Project Manager: Communicate and Manage Any Project with a Single Sheet of Paper. Hoboken, N.J.: John Wiley and Sons
