Gantt chart and Scheduling techniques
Contents |
Abstract
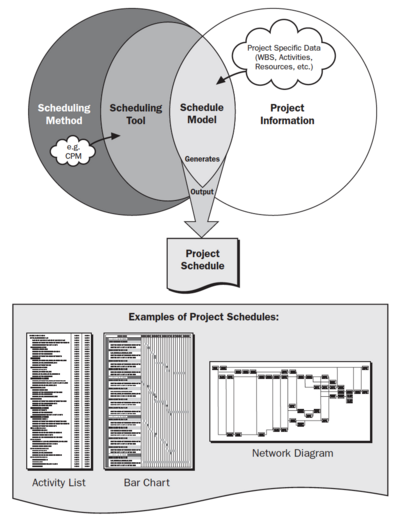
Scheduling is about "determining when an activity should start or end, depending on its (1) duration, (2) predecessor activity (or activities), (3) predecessor relationships, (4) resource availability, and (5) target completion date of the project." [1]
In this article, a review of scheduling techniques Gantt chart and Critical path method (CPM) will be presented. The Gantt chart is one of the oldest scheduling tools and is a graphical way to explain and display the schedule-related information. The tool displays each activity and the duration, and clarify what should have been achieved at a certain point in the time. [2] The limitation with the Gantt chart it that the tool does not show the critical activities, which the Critical path method (CPM) does. The CPM is an algorithm for scheduling a set of project activities in the project. In the CPM a Network diagram needs to be developed. The Network diagram is about identifying the component activities and their relation to each other. [3]
This article will provide a step-by-step guide on how to create and use the different scheduling techniques. Furthermore, this article will explain how the different scheduling techniques can supplement each other, and what the limitations in each scheduling tool are.
Project Time Management

Project Time Management provides the processes that are required in a project with timely completion. The Project Time Management includes six processes which are described below [4]:
1. Define Activities - Identify the activities and actions to be performed to produce the deliverables of the project.
2. Sequence Activities - Identify and document the connections between the activities in the project.
3. Estimate Activity Resources - Estimate the amounts and types of the material, people, equipment, or supplies needed to perform the activities in the project.
4. Estimate Activity Durations - Approximate the number of work periods required to perform individual activities with the expected resources.
5. Develop Schedule - Analyse the activity durations, sequences, resource requirements, and schedule restrictions to produce the project schedule.
6. Control Schedule - Control the status of the project to update project development and managing the changes in the project schedule.
SchedulingA plan can only show the practicability of accomplishing its objectives when the actions and activities in the plan are put together in a schedule that illustrates when each action or activity will be carried out.
|
The Gantt chart
Gantt chart is the oldest form of a formal scheduling tool. The Gantt chart was developed in the 1910s by Henry Gantt, and today used widely as a scheduling tool in projects. A Gantt chart keeps track of the progress of the multiple activities there often is in a project. [5]
Definition
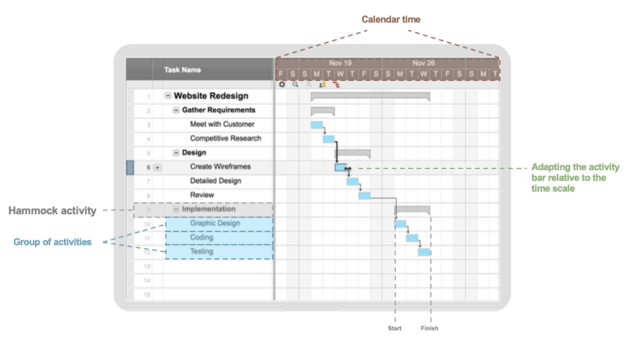
"A graphic display of schedule-related information. In the typical bar chart, schedule activities or work breakdown structure components are listed down the left side of the chart, dates are shown across the top, and activity durations are shown as date-placed horizontal bars.". [4]
Gantt charts are especially useful when scheduling one-time projects. Projects like construction buildings to making films are all projects that. (which project can you use gantt chart?) Overall, however, Gantt chart advantages have been realized by all types of organizations for applicable applications.
1. Avoid Completion Confusion
2. Keep Everyone on the Same Page
3. Understand Task Relationships:
4. Effectively Allocate Resources:
5. Get a Handle on the Future:
Use Gantt Charts More Effectively Using Creately: remeber to use the right tool - then it is easyere to make a gantt chart.
How to create a Gantt chart?
Developing a Gantt chart takes some steps. In the scoping phase determines the level of details and the activities identifies in the project.[6] There are many ways to create a Gantt chart and in the end, it depends on the project and the working style. In the table below some general steps to developing a Gantt chart are described.
| Creating a Gantt chart step by step | |||||
|---|---|---|---|---|---|
|
Step 1 - Creating the axes: Create a sheet with vertical and horizontal axes. The vertical axis represents the activities, and the horizontal axis represents the timescale. To make the Gantt chart more clear and get and an idea of the total time that needs for each activity, adding the calendar time in timescale is a good idea, see figure 1. [6]
 Figure 2: How to create a Gantt chart. Reproduced from: [2]
| |||||
Critical path method (CPM)
What is the Critical path method
Develop in the 1950s by Morgan R. Walker and James E. Kelley. CPM is very similar to PERT(Program evaluation and review techniques), but represent information in a different way.
Definition
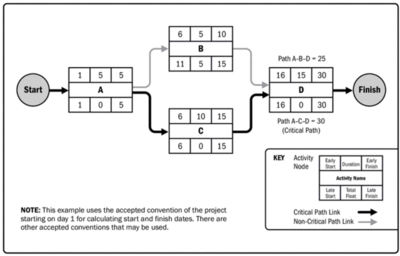
"A schedule network analysis technique used to determine the amount of scheduling flexibility (the amount of float) on various logical network paths in the project schedule network, and to determine the minimum total project duration. Early start and finish dates are calculated by means of a forward pass, using a specified start date. Late start and finish dates are calculated by means of a backward pass, starting from a specified completion date, which sometimes is the project early finish date determined during the forward pass calculation.” [4]
When and why use CPM?
CPM vs. PERT
What is the difference between CPM and PERT?
How to create the Critical path
| Creating the Critical path step by step | |||||
|---|---|---|---|---|---|
|
Step 1 - Specify each activity: All activities need to be specified. The activities are usually drawend from the work breakdown structure.
Dummy Activities - Ladder Activities - Hammock Activities -
Grafical respresentation that shows the arrows to connect the activities (showen in he boxes). Thereby we can collect the informtion that are important for the project.
Step 4 - Estimate activity durations: How long each activity will take.
| |||||
Carson, Christopher Oakander, Peter Relyea, Craig. (2014). CPM Scheduling for Construction - Best Practices and Guidelines. Project Management Institute, Inc. (PMI). Retrieved from https://app.knovel.com/hotlink/toc/id:kpCPMSCBP1/cpm-scheduling-construction/cpm-scheduling-construction
The Importance of the Gantt Chart and the Critical Path for Project Management
How to connect Gantt chart and CPM
For complex, time-critical projects, the CPM/PERT charts might be useful in providing a clear indication of the critical sequences of tasks necessary to keep the project on schedule. However, the Gantt chart—especially when augmented by notations to show dependencies—is easier to produce and update, and is a good all-around project planning tool.
Pros and cons
| Pros | Cons | |
|---|---|---|
| Gantt chart [7] |
|
|
| CPM [8] |
|
|
Annotated Bibliography
Milosevic, D. Z., & Martinelli, R. J. (2016). Project management toolbox: tools and techniques for the practicing project manager. John Wiley & Sons. Provides a step-by-step guide of when and how to construct a Gantt chart, it also provides real-world examples.
Guide, A. (2008). Project management body of knowledge (pmbok® guide). In the Project Management Institute.
A good basis for understanding the different terms and tools in project management.
References
- ↑ Businessdictionary. (n.d.). What is scheduling? definition and meaning. Retrieved February 25, 2019, from http://www.businessdictionary.com/definition/scheduling.html
- ↑ 2.0 2.1 Managing Successful Projects with PRINCE2. (2017). Managing Successful Projects With Prince2. The Stationery Office Ltd. [Available online]
- ↑ Kelley Jr, J. E., & Walker, M. R. (1959, December). Critical-path planning and scheduling. In Papers presented at the December 1-3, 1959, eastern joint IRE-AIEE-ACM computer conference (pp. 160-173). ACM.
- ↑ 4.0 4.1 4.2 4.3 4.4 Guide, A. (2008). Project management body of knowledge (pmbok® guide). In Project Management Institute. [Available online]
- ↑ 5.0 5.1 DuBrin, A. J. (2011). Essentials of management. Cengage Learning.
- ↑ 6.0 6.1 6.2 6.3 Dragan Z. Milosevic, 2003, Project Management ToolBox: Tools and Techniques for the Practicing Project Manager [Available online]
- ↑ Craig Borysowich, Feb 2, 2008, Pros & Cons of Gantt Charts. [Available online]
- ↑ Craig Borysowich, Feb 2, 2008, Pros & Cons of PERT/CPM. [Available online]

