Cost control in project management with Data Mining and OLAP
Thomas Boel - s124865
Contents |
Summary
Cost control is arguably one of the most important skills to master within the discipline of project management. Cost and the ability to stay on the set budget is often used as the direct measure of the performance or success of a project, and as it is intrinsically bound up on virtually every other aspect of the project, early information on shortcomings of cost control measures can be an important warning sign telling about other aspects of the project undergoing unforeseen or underestimated challenges or to entail drastic changes or perhaps even failure the project. Therefore it is a heavily studied subject in the literature of project management. However, it still remains one of the most common ways to fail to deliver within a project. Even if the quality of the project deliverables are exactly what was asked for and it was delivered on time, if it was not on the budget or close to, it will often be regarded as (at least partial) failure. Data Mining and On Line Analytical Processing [1] provides an additional tool to cost control, that helps enable project managers and cost controllers to take advantage of previous experience from projects with similarities. Data mining and OLAP provides tools for gathering a vast amount of project cost related data and systematically aggregate them for recurring use for forecasting, visualization, early warnings and more. However, the method also has its limitations and could never stand alone. It still requires the project manager to other aspects of cost controlling to give the most reliable results. In this paper, the basics of cost control will be reviewed to provide the framework for applying data mining within project management. Examples of applications of data mining and OLAP in projects will be assessed and their advantages and shortcomings will be discussed.
Big Idea
Would it not be nice, if we could just do projects all day and never have to worry about the cost? Such thoughts have no place in the real world, where projects success and performance is measured directly by how much it has cost compared to how much was budgeted to cost. If you send your hungry project manager to McDonalds to get the team for 80 kr. of junk food per person and he returns having spent 125 kr. per person, it obviously will be regarded as a failure, disregarding the fact that you had the food delivered to your desk and you all have Sundaes and Tops. The same thing goes with projects, where the making or breaking of a project budget can determine whether or not you will be reassigned to such projects again.
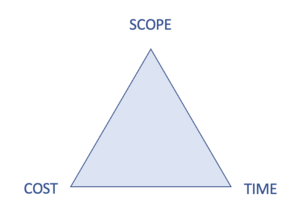
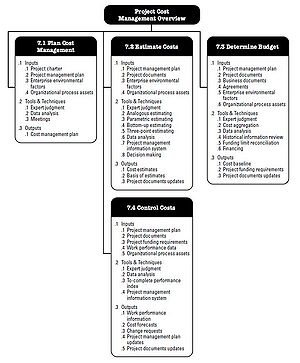
For projects and management of cost control, it can be a lot more complex, as the cost of the project is tightly bound to almost every other aspect of the project. To illustrate this, the Iron Triangle, see figure 1, is often used, as it shows the three dominant constraints of projects, time, scope and cost as being interrelated to one another, meaning, that if you alter one of them, it will unavoidably also affect the other two. If it takes an extra two months to implement the new software or build a bridge, the project still has to keep paying its workers for that duration.Therefore, to successfully control the cost of the project, measures and procedures can be applied to provide realistic estimates of the budget and track the performance of the project and its cost. These cost control and assessing measures rely on details from other tools commonly used in project management, such as the project charter, WBS, enterprise environmental factors, agreements and many more. According to the Project Management Body of Knowledge (PMBOK), there are four processes to incorporate to get the best reliable overview and control of costs in a project. These are Plan Cost Management, Estimate Costs, Determine Budget and Control Costs, and a more elaborated overview of these can be seen in figure 2 [2]. In summary, they can be recapped as an encouragement to have a well defined, detailed plan of the project, using this to correctly estimate costs and hence determine the actual budget as more details and knowledge is attained and lastly to measure the progress of work and costs throughout the duration of the project. This PMBOK approach relies on, amongst others, two distinct tools used in every step, namely expert judgment and data analysis. As valuable as expert judgment can be, it is not just a bit vaguely described and can be difficult to quickly attain if you have little experience from other similar projects. It also relies on amongst others, previous experiences from similar projects. This is exactly where the data mining and OLAP compliments the existing methods by giving a structured approach on how to gather data from previous experiences and put them use from current and future projects.
Data mining and OLAP general idea
Of course, project managers always try to use historical data to assist their decisions for new projects, but it is, according to an article by Lu Zhao [1] not until it is done in a systematic and consistent way over data from several projects that the project manager can reap the full benefits of this data. Therefore Lu Zhao suggests a method, where data is systematically collected and stored in data cubes in a data warehouse, so it can easily be aggregated in new ways, extracting and comparing relevant parameters over time. An example of such a data cube could look like figure 3. Here the data points are stored in a multidimensional array combining, time, estimated and actual cost, participants and other relevant statistics in one data point. Having several of these data cubes, stored in a data warehouse, then allows users and project managers to access them and visualize patterns from earlier in the project or from earlier projects in an easy and relevant way.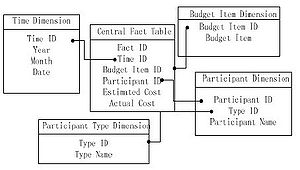
Collecting the data cubes
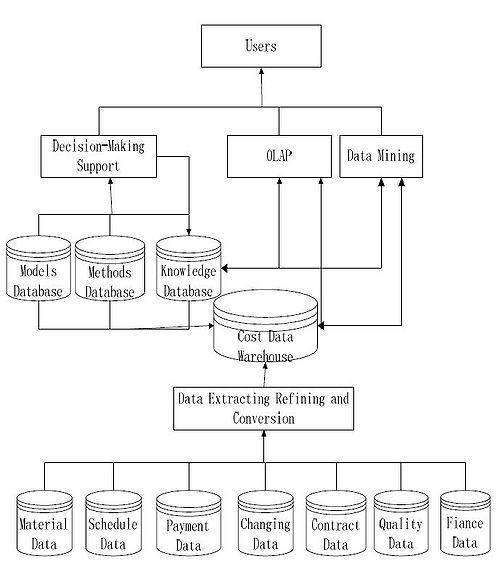
One of the most important aspects of the data cubes are their multidimensional structure, and therefore to make them as useful as possible, they should be established in a consistent manner, meaning that as far as possible, they should have the same input variables. In the example figure 5 of the data cube, see fig 5, a few examples of parameters are shown, but in reality, one would like to add as many relevant parameters as possible. This is done to enable comparison of parameters between phases of a project or over several projects where the same parameters are relevant to compare over. In figure 5 an example of a data cube with parameters relevant to construction projects is shown with seven different branches, all with several subparameters is shows. Such a level of detail gives the user a myriad of possibilities to aggregate and visualize data.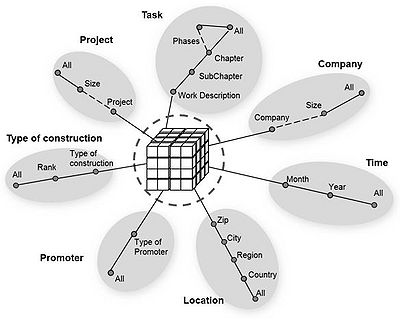
So the first task at hand when deciding to use data mining and OLAP is to establish an overview of all the relevant parameters you want to collect data from. Especially if one is working in the same field over several projects or if it is just a single big project, the data mining and the analysis done from it can start to provide the benefits from this method.
Benefits
The benefits of this method of cost control are:
- A systematic approach to gathering valuable data, so the data can compliment itself in many more ways, then if the data had been more sparsely collected in less systematic ways. The project manager knows what data he or she is interested in collecting and can from there do thorough analysis and visualization of cost aspects of the project, that would not else wise have been possible to establish, or would have had a lot less detail from having fewer points.
- Visualizing data gives new insights. As a project manager you always have too much, too little or inconsistent data, and from there it can be a tough challenge to know how to look at all this data. With the multidimensional but consistent data gathered from previous experiences, you still have a lot of data, but when knowing that it is consistent, you can easily sieve through the parameters and analyze them from so many ways. On top of that, this also allows you to visualize the data exactly in the relevant way to explore new aspects of cost development, and see interdependencies and trends, that would have been impossible or extremely complicated with less systematically collected data.
- As visualization is just one sort of algorithm build on top of the PCMS, so one can add on more algorithmic tools, such as decision-making models. Amongst all the knowledge stored in the database, you can save and use predefined algorithms for making for example regression over data, trends and more. So you can also store previous reactions and decisions in the database. If for example one particular model or trend calculated from the data prompted the project manager to make a decision, this can and should also be stored systematically in the database, so the future aggregation of data can recognize the pattern and suggest a catalog of previously tested reactions to this sort of situation.
- Early warning systems are also a possibility with this way of working with project data. With predefined and built-in automatic frequent aggregation of the project cost data, forecasting is possible to visualize and can be set to evaluate the actual and forecasted costs to the estimated and budgeted costs. In cases where there is a risk of overrun of the budget, it can be automatically spotted and dealt with earlier in the project, before the overrun has happened. In figure 6 such a visualization is exemplified from the article of Lu Zhao[1] .
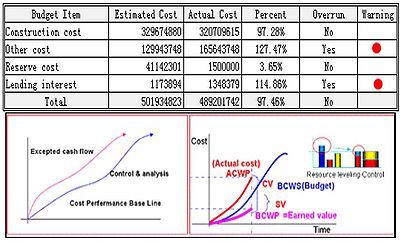 Figure 6: Illustration of how the OLAP spots an expected cost overrun before it happens [1].
Application
So how do you get started using these methods to assist your project cost control? Firstly, before just trying it out, it would be relevant to study the method and other users' application of it, to get a good overview of the applications, benefits, and limitations of this strategy. A suggestion would be to check out the sources mentioned in further reading and supplement these with more research of your own. When the project manager is ready to implement this data mining tool, start on setting up a server to host and store all the data you will be collecting. Structured Query Language (SQL) are the types of servers one would use to store and handle this sort of data. Now comes the more difficult part. Find out what data is typically relevant to the cost control of the projects you usually do. This can be better done in groups or individually be several people to try and catch as many relevant aspects as possible, so your consistent data can start as early in the process as possible for better options of using data later on. Look at a series of previous projects and programmes in your research field or organization to gain insight into what parameter are involved with the project cost. It can be quite a lot, but the more the better. When this is done, establish procedures to have contractors, employees, project workers, and managers log these relevant parameters as they conduct the project. And when you have enough data collected, you can start analyzing it. Even a little data can make sometimes useful insights, but generally, the more data you have the more reliable your analyzes will be.
An example of application
This method has been used and tested in probably every field of science, but more often you see it used within construction projects or other big scale projects that stretch over a long time. One example is from a series of construction projects where the team behind had gathered data in the following categories [3]: Project, scale. Was it a series of projects or an unrelated project? Was it small, medium or big? Time. Very important as prices for materials, labor and others can vary through time, and because time is typically a parameter you will want on one of the axes when visualizing data. Location. Also has a significant impact on price ranges within construction projects Promoter. Was there a promotor or project sponsor who finances the project, and was it private or public promotion? Type of construction. Of course, this has huge implications on the cost of the project, so it is a relevant parameter to sort the data by for comparison Company. Sorted by the size of the company, number of employees. Task. WBS at different levels.
From these gathered data over several projects, the research team could ask the PCMS the following queries and get the following outputs. The following text and pictures are taken directly cited from Rojas [3], however some of the text has been omitted to keep this article short.
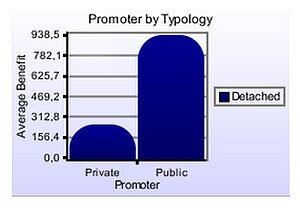
Query 1: “Average benefit of detached projects depending on the promotor typology”.
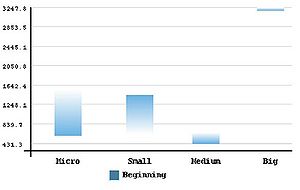
Query 2: “Average benefit in the beginning phase according to the company size”.
Query 3: “Maximum cost deviation in each phase for each residential project typology”.
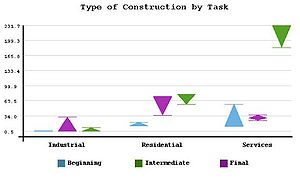
Query 4: “Maximum cost deviation in big-sized projects according to the project phases”.
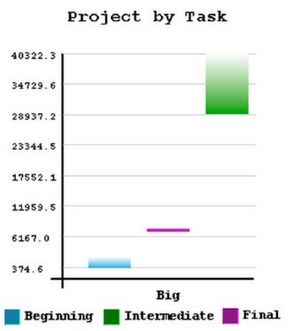
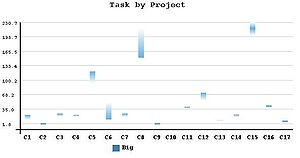
Query 5: “Average cost deviation in big-sized projects according to the project chapters”.
Limitations
References
- ↑ 1.0 1.1 1.2 1.3 1.4 1.5 L. Zhao, Project Cost Control System Based on Data Mining, International Forum on Information Technology and Applications, 2009.
- ↑ Project Management Institute, A guide to the project management body of knowledge (PMBOK guide), Project Management Institute, Inc., 2017.
- ↑ 3.0 3.1 3.2 3.3 3.4 3.5 3.6 3.7 M. Mart´ınez-Rojas, Cost Analysis in Construction Projects using Fuzzy OLAP Cubes, Ieee International Conference on Fuzzy Systems , 2015.
