Planning Methods - 3 Levels of Project Planning
Planning methods is a key feature in Project Management and helps to create an overview and structure in projects[1]. Planning gives the Project Manager control over the amount of time spent on activities, particularly to improve efficiency for a better project schedule. Depending on the specific tasks and their complexity, the planning can be done at 3 different levels:
- Network Planning
- Gantt Chart
- Cyclogram Planning
The 3 project planning methods differentiate in the number of dimensions and represent a sequence of activities (1 dimensional), duration of activities (2 dimensional) and location of activities (3 dimensional). The goal of all 3 planning methods is to show a path from the beginning to the end of the project, but the difference lies in how the path is visualized and planned. The first two planning methods are part of the Critical Path Method (CPM) and the last planning method is Location-Based Scheduling (LBS).
The following article gives an insight into how the 3 Planning Methods benefits Project Management and focus on similarities and differences between the methods depending on the project.
Contents |
Project Planning Methods
Critical Path Method (CPM)
CPM is one of the most common project management scheduling techniques used since it was introduced in the late 1950s and it is based on mathematical calculations[2]. The technique is an algorithm for resource utilization to schedule numerous project activities and through the use of Work Breakdown Structure (WBS), it is possible to identify the activities in a project.
The essential method for using CPM is to define the project scope by identifying all the activities that need to be executed for completing the project. You are then able to detect dependencies between the activities and estimating the duration that each activity will take to complete. This will help one to determine the critical path and distinguish activities that are critical to be completed on time and which can be delayed without making the project longer[3]. The activities that have a direct effect on the completion date of the project is are part of the critical path. A critical path diagram needs to be updated when the project progresses, so the duration prediction can be refined. There are several ways in order to that for instance, through the use of a Network diagram or a Gantt chart.
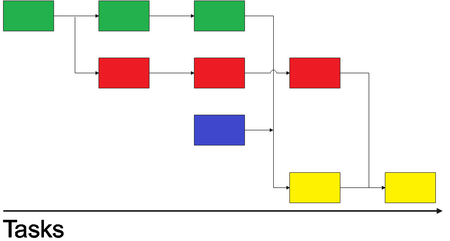
Network Planning 1D
Network planning is a CPM and a tool to develop project schedules. The method visualizes the importance to carry out tasks in a project in a particular order where one task must be completed before beginning a new one. The aim is to find the correct order and connection for the activities so that they can be carried out effectively. The Network diagram consists of a sequence of connected arrows and boxes to define the inter-relationship between the project activities. The boxes represent the activities and the arrows show the relationship among the activities and tell when a specific activity start and finish and how the dependency on the other activities fall within the specific activity[4].
The diagram is useful for a quick rundown of the project activities and is functional at the beginning of projects to visualize the tasks included in the project. Network diagrams have the advantages to show a logical relationship between activities and identify the critical path. The disadvantage is that when the project becomes too detailed, you cannot settle for an analogue diagram like this, as it only shows the order of activities and thus has only 1 dimension. Network diagrams are not suitable for linear scheduling and repetitive activity projects[5].
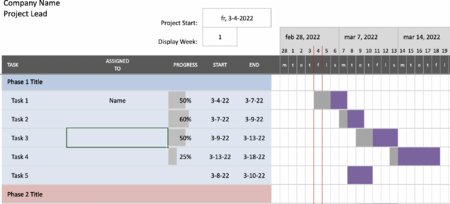
Gantt Chart 2D
Another assumption in CPM is that it is possible to predict the duration of all activities. A Gannt Chart visualizes the duration of tasks against the progression of time and enables the manager of the project to[6]:
- Determine the starting and end dates of the activities
- Establishing interactions of dependence between activities
- See what was to be accomplished at a certain point in the project schedule
- See if the strategy can be set back on track by remedial measures
As illustrated Gantt Chart is represented as a graphical bar graph and uses x-axis as time (months, weeks, days, or hours). The y-axis reflects the various activities in separate rows.' Furthermore, the Project Manager can with a graphical representation as the Gantt Chart expose project and activity inefficiencies, so it is omitted from the project schedule. The Chart will also help to assess the effects on the project of delays and other non-critical activity that may require immediate execution.
The Gantt Chart is therefore a valuable 2-dimensional interactive project management tool for all forms of projects such as construction, software development, and other products and services[7].
Location-Based Scheduling (LBS)
LBS is a resource-oriented planning approach where resources flow through the project is a key part of planning. The method became known in the construction industry in the 1930s during the construction of the Empire State Building in New York. CPM has been a dominant method of use, but the method has been criticized (particularly in construction projects) for not adequately supporting construction management during execution and for not providing a continuous and economic flow of resources[2].
LBS uses the Line-of-balance graphical presentation method, which is adapted for workflow planning and management that enables resources to conduct their work without interruptions caused by other resources operating in the same location as other activities. So LBS ads a geographical location to the activities of the project to define where and when the activities are to be carried out. This Line-of-balance graphical presentation is known as a flowline diagram or also known as a "Cyclogram".
Cyclogram Planning 3D
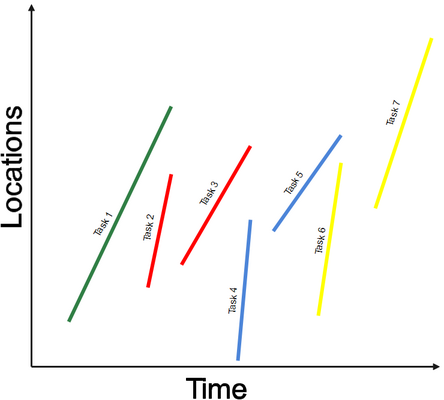
Cyclogram planning is based on LBS and is a method where planning is depended on location. A Cyclogram, also called a flowline diagram, shows both when activity begins, the duration and the location. Here you need to understand where and when the activities need to be carried out and are particularly useful in the construction industry when building constructions.
Cyclogram provides a graphical overview of the project schedule, which helps in achieving an efficient flow of activities. You can adjust the activities if you want a greater distance between them and thus create a more balanced and efficient project schedule. In addition, we can with a cyclogram assign resources to a given activity in question to ensure it is performed at the desired time.
The illustration shows the activities in the form of lines. The x-axis reflects the project timeline and the y-axis reflects the project physical locations. The activities and their course are interpreted as lines, where the slope reflects the work intensity at which the activity is carried out.
If the activity forms a continuous straight line that is not broken, it indicates the workflow of the activity is uninterrupted. Crossing lines means that several activities take place in the same place at the same time, which is not ideal. The cyclogram visualized any imperfections so that you can easily adjust the project schedule as you desire. For greatest efficiency, the lines should be as close to each other as possible. If there is too much distance, it indicates that no work is being done in a specific location, which is inefficient and wasteful. This can be achieved by modifying the resources and the working speed to ensure that time is used efficiently.
Cyclogram is an improved planning tool but has its challenges such as new concepts and new approaches to scheduling, which can be difficult to implement. It is also more relevant for building projects and other location-based project and therefore hard to compare to planning tools like the Gantt Chart. Another difficulty identified is a lack of a coherent and standardized information system that will facilitate the use of LBS software[2].
Application of the methods
A Project is a temporary effort that requires a number of tasks to be completed in order to achieve the desired result. Network Planning, Gantt Chart and Cyclogram Planning are all tools to manage, visualize and aid the Project Manager with the project tasks to reach the desired result. Network Planning is useful in the early stages for a quick-glance view of the project and to determine the critical path. When the project activities become more detailed and duration is added to plan the start and finish of the project, the Gannt Chart can provide that extra dimension. Both Network Planning and Gantt Chart are tools that also can be applicated in Program or Portfolio Management. Program Management is the process of managing several related projects and therefore can have the same benefits from Network Planning or Gantt chart as just one project. Portfolio Management is a higher-level approach that orchestrates the potential value of many projects, where Network Planning or Gantt chart can be applied to visualize a roadmap to view all the projects in the portfolio and find synergy between projects just like tasks in Project Management[8].
Location-Based scheduling with Cyclogram Planning is however only appliable in specific projects since it is depended on activities in physical locations. This method is more commonly utilized in building projects that use distinct location-based axes, yet it can also be applied to linear infrastructure projects such as bridges or tunnels[9]. LBS is for now a scheduling technique that is only applicable to construction projects.
Similarities
CPM and the LBS method focuses on two different things, but both methods demonstrate which activities are most necessary for the project to be completed on schedule, the effect of changes in the duration of tasks, and the activities that can be changed to speed up the process. They both strive to identify links between the activities and furthermore show the progress and what tasks have been carried out and what delays have repercussions for the project.
Nowadays software is even able to use Gantt charts to visualize Location-Based schedules but is much difficult since it required the ability to code activities according to the physical locations within which the work is done. The structure of the code itself needs the ability to be hierarchical to allow the structure of the breakdown to be equal to LBS[9]. A Cyclogram thus more suitable to graphical represent a location-based project with flowlines instead of bars.
Differences
The fundamental difference between CPM and LBS is that the method of CPM is focused on the activities and their logical links to each other, while the method of LBS is based more on the resources and their flow through the project. LBS can show the resources which CPM lacks. The big difference is that CPM is activity-based, while LBS is resource-based. Instead of managing resource constraints, the CPM is designed to optimize project duration to ensure easy resource efficiency[10]. The methods limitations and advantages are most of all project depended especially since LBS is location orientated but is able to the same as CPM. CPM can yet become too complex to manage and maintain when activities are too detailed, where LBS still able to offer an understandable visual representation of the project activities.
Annotated Bibliography
Axelos (6th edition2017). Managing successful projects with prince2.
- The book is a great tool for the Project Manager and describes the practical use of planning techniques and scheduling strategies to efficiently manage projects. Chapter 9 goes into detail with planning guidance and especially section 9.4 elaborates why a Gantt Chart is a useful scheduling technique.
BYG·DTU, Andersson, N., & Christensen, K. (2007). Location-based Scheduling. Vurdering af LBS-metodens anvendelse i byggeprojekter.
- This report deals with Location-based Scheduling, a cyclogram based planning method that is especially useful for resource-based projects. It is based on current literature and empirical studies to determine the use of Location-Based Scheduling (LBS) in building projects.
Slate, A. Critical Path Method: A Project Management Essential.
- This article describes why the Critical Path Method (CPM) is an essential method for Project Management and to use it. The article dives into how the critical path is identified and why it is so important to identify it.
Alamdar, S. (2013). Location Based Scheduling in the Form of Flow Line and its Comparison to CPM/Bar Chart Scheduling.
- The main goal of this thesis is to examine differences between using Location Based Scheduling over CPM/Bar Chart Scheduling. It also elaborates on how LBS scheduling can work on small projects, which use to be CPM advantage.
References
- ↑ Barron, M. & Barron, A., Watt A. 8. Overview of Project Planning. Opentextbc.ca. Published August 14, 2014. Accessed February 18, 2021."Overview of Project Planning"
- ↑ 2.0 2.1 2.2 BYG·DTU, Andersson, N., & Christensen, K. (2007). Location-based Scheduling. Vurdering af LBS-metodens anvendelse i byggeprojekter. Technical University of Denmark (DTU). "Location-based Scheduling"
- ↑ Slate, A. Critical Path Method: A Project Management Essential. Wrike.com. Published 2018. Accessed February 19, 2021. "Critical Path Method"
- ↑ Verma, E. Network Diagram: An Important Tool for Effective Time Management. Simplilearn.com. Published January 30, 2012. Accessed February 20, 2021. "Network Diagram"
- ↑ Mubarak, S. (2010). Construction project sheduling and control. New jersey: Jhon wiley and sons.
- ↑ Axelos (6th edition2017). Managing successful projects with prince2. The Stationery Office Ltd. ProQuest Ebook Central "Managing successful projects with prince2"
- ↑ Gordon, J.Gantt Chart - Definition. The Business Professor. LLC. Published 2020. Accessed February 19, 2021. "Gantt Chart - Definintion"
- ↑ Project Portfolio Management. Project Portfolio: The Ultimate Guide to PPM - ProjectManager.com. ProjectManager.com. Published February 22, 2021. Accessed February 23, 2021. "Project Portfolio Management'"
- ↑ 9.0 9.1 Turbo Chart. Turbo-Chart: Location Based Scheduling. Published December 19, 2019. Accessed February 26, 2021. "Location Based Scheduling Method'"
- ↑ Alamdar, S. (2013). Location Based Scheduling in the Form of Flow Line and its Comparison to CPM/Bar Chart Scheduling. Institute of Graduate Studies and Research. "LBS compared to CPM"


